The situation in NSW yesterday felt a bit like a rollercoaster ride. As the late afternoon approached, the supply-demand balance looked precarious – but thankfully, the lights stayed on and the run of extreme high prices eventually subsided before the late afternoon.
Our team noted some interesting takes in the post-mortem analysis this morning – both on social media and from the traditional media. Many people were quick to draw conclusions, with these takes ranging from ‘why did the energy system struggle when it wasn’t even that hot’ to ‘batteries saved the day’.
Many of those types of conclusions didn’t pass our smell test – so this post is planned to be the start of a case study that will eventually examine (1) the demand-side factors, (2) supply-side factors, and (3) network factors. As time permits, myself or another member of our team will look to follow these analysis threads in Part 2.
An unusual demand shape
One of the most distinctive and tell-tale characteristics of what happened in NSW yesterday can be seen in the shape of market demand.
Linton Corbet has produced the very handy interactive graph below for me (thanks Linton!). It highlights that the shape of demand in NSW yesterday was unusual because the peak occurred 1 to 2 hours earlier than what we would have expected.
How the shape of NSW market demand (a.k.a total demand) looked yesterday compared to the previous 30 days. Note: times shown are in NEM time.
The ‘generation type x saved the day’ narratives that we typically observe after days like yesterday are usually over-simplistic. This is especially the case here, as the graph above suggests, that whatever potentially worse situation was avoided yesterday, can at least partially be attributed to one or more demand-side factors that altered the shape of demand yesterday.
Demand-side factors
In a future article, we hope to dig a bit more into the outages, bidding, constraints, etc. but in this post, I will start by taking an early look at weather and demand response – two factors that may have contributed to the shape of market demand that eventuated yesterday.
Weather
Was it even that hot yesterday?
Yes, and unseasonably so. In fact, Ben Domensino determined that Penrith was the hottest place anywhere in the world at 10am (NEM time) yesterday morning.
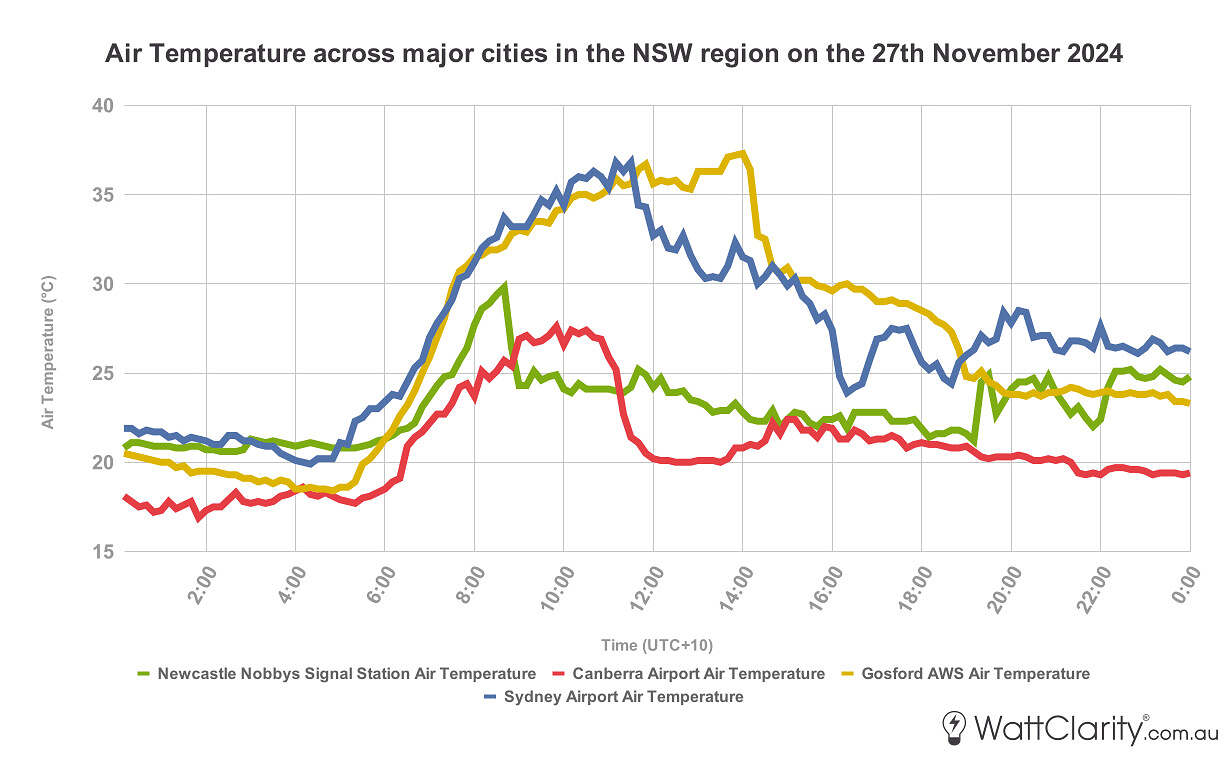
But importantly, the day began very hot in NSW – with temperatures in Sydney already above 30 degrees before 8am (NEM time).

Air Temperatures around major load centres in NSW rose very quickly in the morning but experienced an early reprieve in the middle of the day. Note: times shown are in NEM time.
Source: NEMreview
Thankfully, temperatures started to subside just before midday for most parts of the region.
It’s worth noting that there can be a delayed relationship between high temperatures and electricity demand for air-conditioning, because of the thermal lag experienced in buildings. Thermal lag describes the rate at which a material absorbs or releases stored heat. For materials with high thermal mass (e.g. concrete and brick) that delay is greater – for example, a standard 100mm thick slab of concrete has a thermal lag of approximately 4 hours.
Wind and increased cloud clover coming in from the west are likely to have contributed to temperatures in NSW beginning to cool in the early afternoon (but would have also concurrently had some impact on rooftop solar generation – but we hope to explore that in a later article).

Easterly moving cloud cover is likely to have contributed in helping to alleviate high temperatures in the middle of the day yesterday. Note: times shown are in NEM time.
Source: Windy
Demand response
At around 3pm (NEM time), the AEMO published a press release stating that government agencies had been requested to reduce electricity grid consumption. A couple of our readers commented on that article that these protocols included turning off unused office equipment, adjusting air-conditioners, closing external facing blinds, etc.
At around 3:47pm (NEM time), the AEMO published a market announcement that the RERT mechanism had been triggered for the region. Earlier today, Linton was able to forensically analyse the next-day public data, and determined that 65 MW of RERT was dispatched between the 15:50 and 16:45 dispatch intervals.
RenewEconomy reported yesterday evening “AEMO said it had also dispatched contracts under its reliability and emergency reserve trader mechanism (RERT), and it is believed this included 75 MW of demand response capacity through Enel X.”. We will need to wait for the official AEMO reporting to be released to determine if this stated contribution by Enel X was the amount contracted (as opposed to dispatched) through RERT – but it is also possible that this stated figure is a combination of what was dispatched by Enel X through both RERT and the WDRM mechanism.
WDRM in NSW provided small contributions during a period between the 14:45 and 16:45 dispatch intervals – but this contribution only hit a maximum of 14MW. Total registered WDRM capacity in NSW is just 33MW for the ‘energy’ commodity.
Although there is a lack of visibility of behind-the-meter demand response, most people assume that there is a material amount of C&I customers on spot-exposed retail contracts (and a slowly growing number of residential users too) – these C&I users can hedge their load through a combination of physical and financial means. Depending on the primary purpose of the plant and operational protocols in place, the response times can vary significantly.
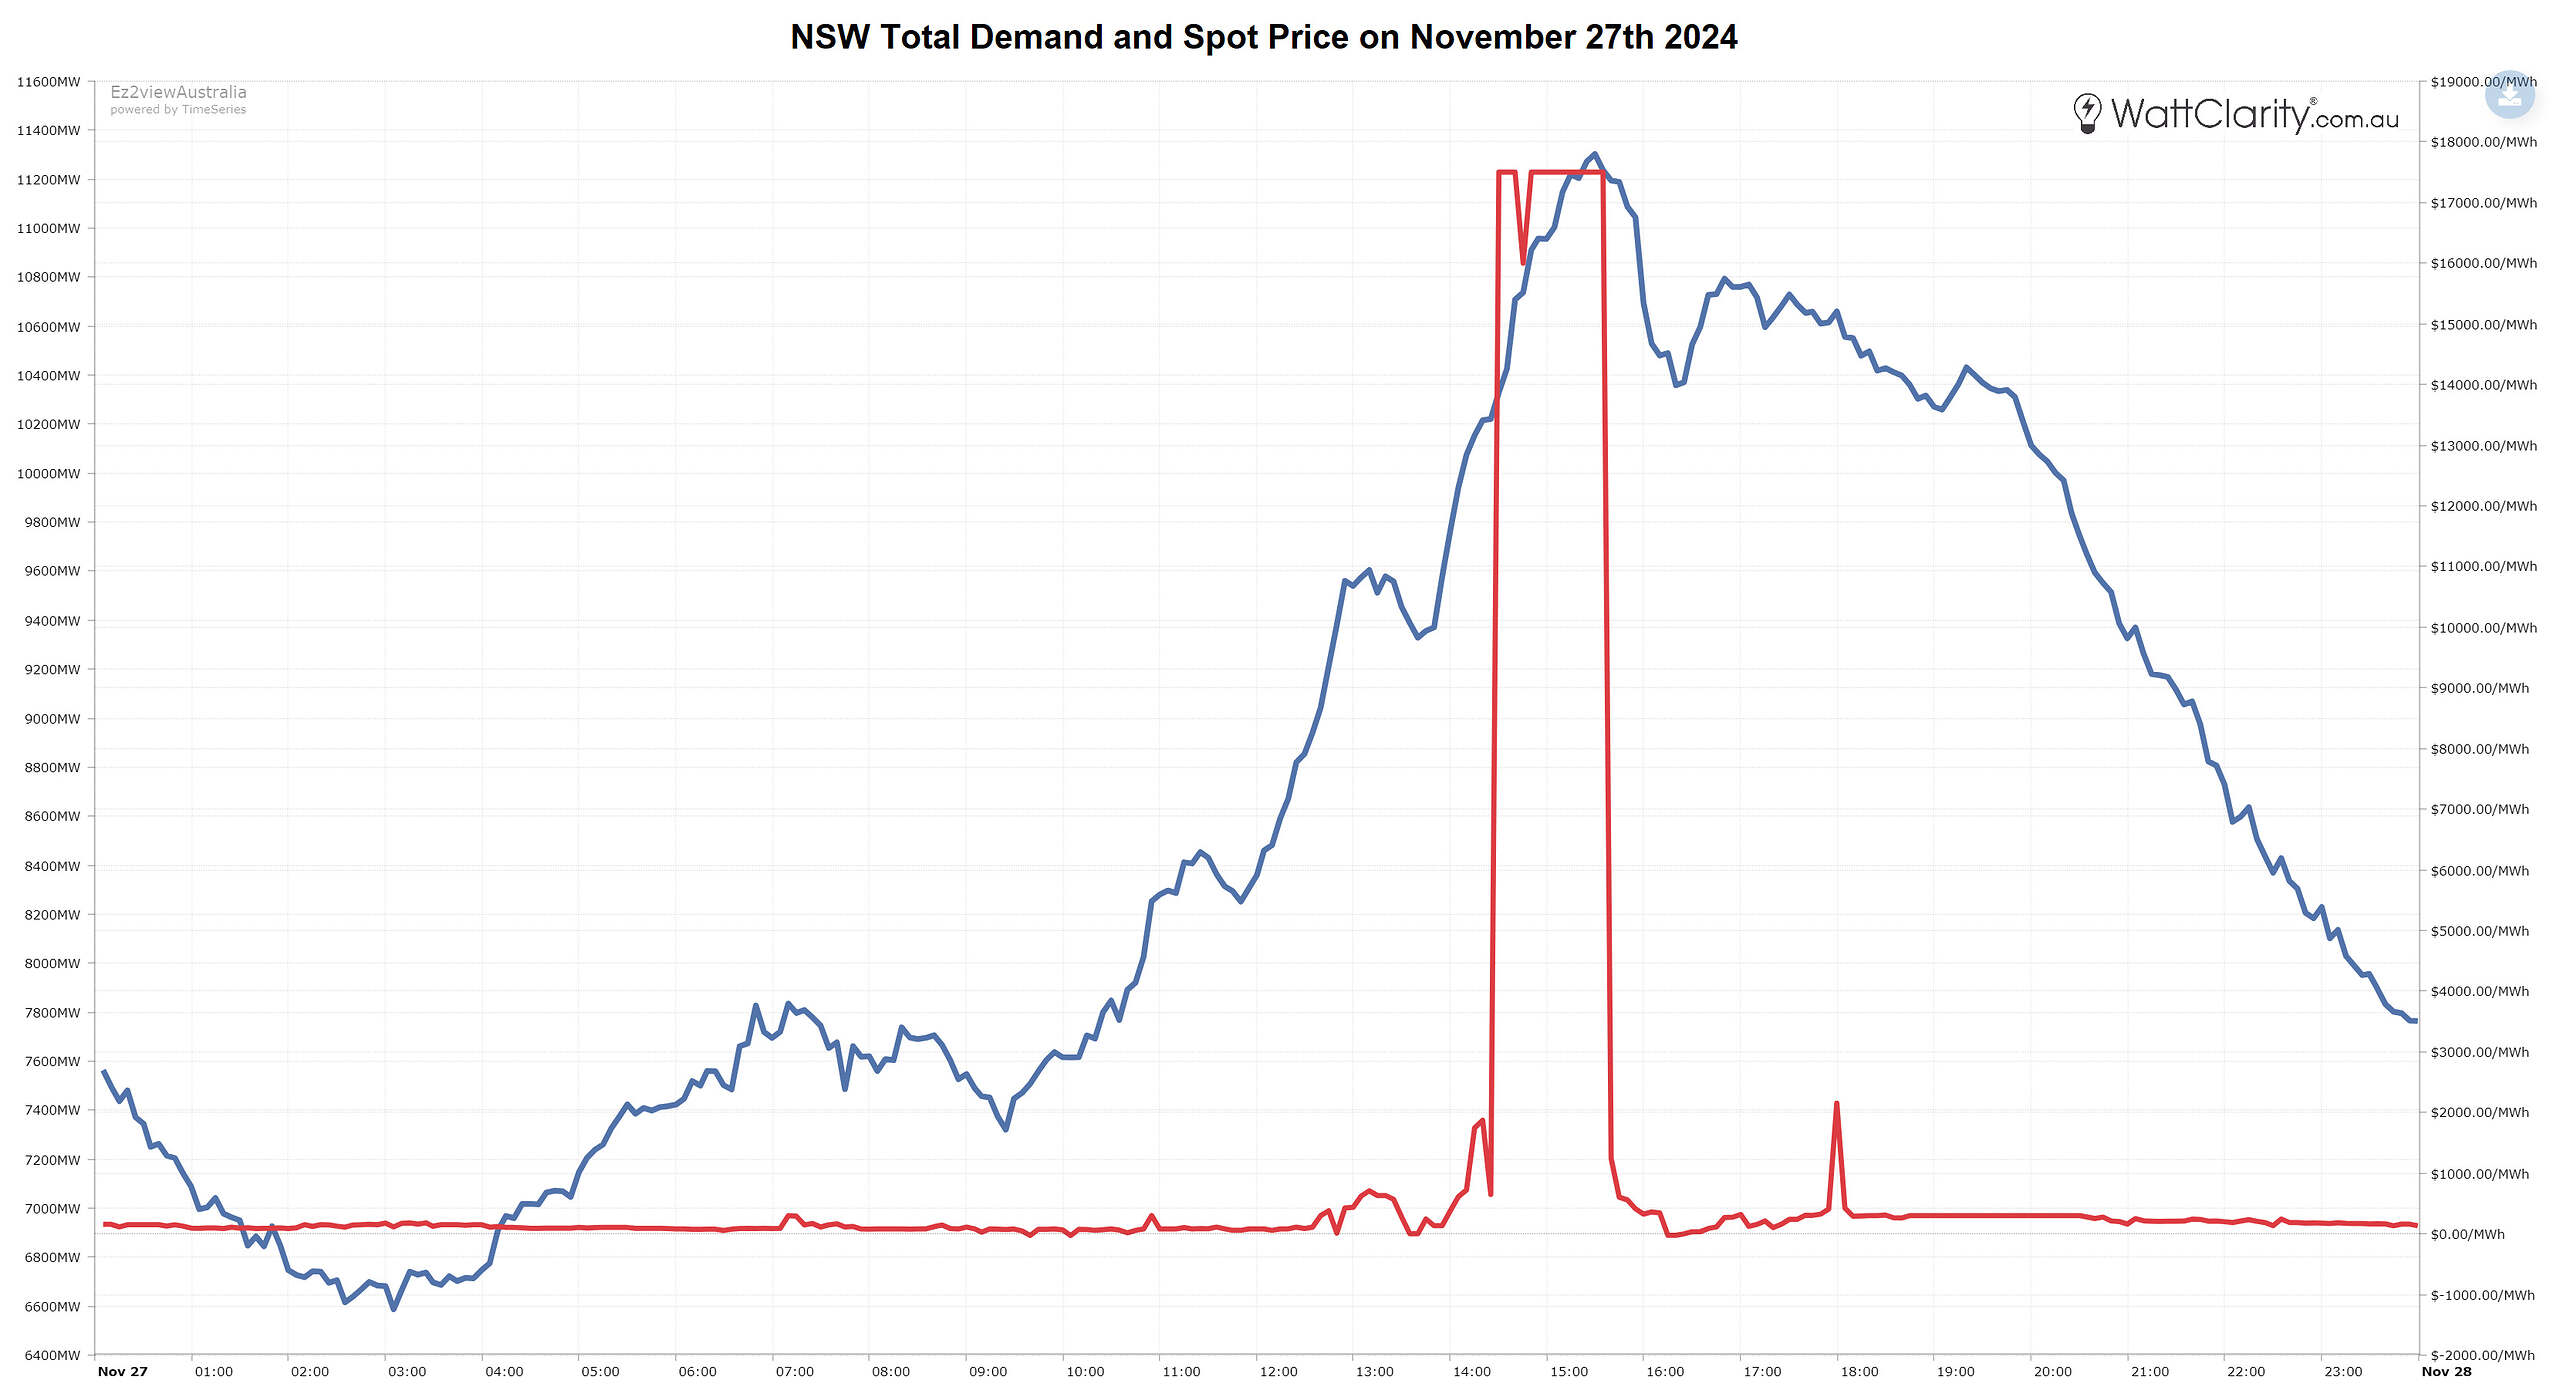
 The price spiked at or near the market cap ($17,500/MWh) for nearly an hour yesterday afternoon.
Source: ez2view’s Trends
More to follow…


Leave a comment