
Last week I published Part 1 of ‘who’s who in the ESOO’ where I looked to identify the projects that were delayed or removed in the updated modelling for the latest ESOO.
Here I will close the thread by listing the projects that progressed between the two versions, which should provide further insights into the state of the NEM’s development pipeline.
Newly progressed capacity
On Page 11 of the May update of the ESOO, the document states “Approximately 4.6 GW of new generation and storage capacity has advanced sufficiently to be considered in this ESOO update since the 2023 ESOO, published in August 2023”.
The next page goes on to state that this figure comprised of “over 3 GW” of battery projects and “over 1 GW” of solar and wind projects, but with no mention of specifics.
With some difficulty, I believe I’ve managed to track down 3.9 GW of projects from this figure using the generation information record kept by AEMO. As I alluded to in Part 1, this data source is not always reliable or easy to analyse – so please leave a comment if you know of any of the projects that make up the missing 0.7 GW, or if you spot any mistakes.
| ESOO 2023 | ||||
| Project | Region | Original (August 2023) | May 2024 Update | |
| Generation | Aldoga BESS (200 MW / 400 MWh) | QLD | Proposed – No Expected Date | Anticipated – Expected November 2025 |
| Banksia Solar Farm (70 MW) | QLD | N/A | Anticipated – Expected September 2025 | |
| Brendale BESS (205 MW / 410 MWh) | QLD | Proposed – No Expected Date | Anticipated – Expected June 2026 | |
| Bungama BESS (150 MW / 300 MWh) | SA | Proposed – No Expected Date | Anticipated – Expected October 2025 | |
| Culcairn Solar Farm (350 MW) | NSW | N/A | Anticipated – Expected July 2026 | |
| Greenbank BESS (200 MW / 400 MWh) | QLD | Proposed – Expected December 2024 | Anticipated – Expected February 2025 | |
| Horsham Solar Farm (119 MW) | VIC | Proposed – No Expected Date | Anticipated – Expected December 2024 | |
| La Trobe Valley BESS (100 MW / 200 MWh) | VIC | N/A | Anticipated – Expected July 2024 | |
| Liddell BESS (500 MW / 2,000 MWh) | NSW | Proposed – No Expected Date | Anticipated – No Expected Date | |
| Lockhart Hybrid Facility – BESS (10 MW / 20 MWh) | NSW | N/A | Anticipated – Expected April 2025 | |
| Lockhart Hybrid Facility – Solar (10 MW) | NSW | N/A | Anticipated – Expected April 2025 | |
| Mortlake Battery (300 MW / 600 MWh) | VIC | Proposed – No Expected Date | Anticipated – Expected March 2027 | |
| Mt Fox BESS (300 MW / 600 MWh) | QLD | Proposed – No Expected Date | Anticipated – Expected November 2026 | |
| New England Solar Farm Stage 3 (320 MW) | NSW | Proposed – No Expected Date | Anticipated – No Expected Date | |
| Richmond Valley BESS (275 MW / 2,200 MWh) | NSW | N/A | Anticipated – Expected October 2026 | |
| Tamworth BESS (200 MW / 400 MWh) | NSW | Proposed – No Expected Date | Anticipated – Expected November 2026 | |
| Terang BESS (102 MW / 200 MWh) | VIC | Proposed – No Expected Date | Anticipated – Expected December 2025 | |
| Tilbuster Solar Farm (249 MW) | NSW | Proposed – Expected March 2026 | Committed – Expected March 2026 | |
| Woolsthorpe Wind Farm (72 MW) | VIC | Proposed – No Expected Date | Anticipated – N/A | |
| Whyalla Hydrogen Power Station (204 MW) | SA | N/A | Anticipated – Expected December 2025 | |
If you spot any errors or missing information in the table above, please leave a comment.
From looking at the table above, two key points immediately stand out to me:
- Half of these projects are expecting completion by the end of next calendar year; however,
- Only one of these twenty projects is marked with the ‘Committed’ status. As I mentioned in Part 1, projects marked as ‘Anticipated’ were excluded from the central scenario of the reliability forecast in prior years.
These two points might raise concerns in either 1) the confidence of those expected completion dates, or 2) the loose categorisations of project statuses.
Shortcomings in project status reporting
I’ve compiled the table above from scraping historical versions of the generation information dataset. For context, the dataset is managed by the AEMO and populated through the Generator Survey process (which is specifically conducted for ESOO modelling purposes). It is NER Clause 3.13.3A that provides the market operator with the power to request this information from registered participants (including project developers).
Beyond its original purpose, industry stakeholders often use the same dataset as the basis for their forward-looking projections when making decisions on investment, policy, financial positions, etc.
To the best of my knowledge, this is the only official (and most reliable) public record of development projects in the NEM and their current status. However, those familiar would be aware of its many shortcomings.
The information is largely self-reported, and survey responses are not always returned on a consistent frequency, and some entries appear either unreliable or outdated.
For example, the La Trobe Valley BESS is currently marked as ‘Anticipated’ and has an expected completion date of July 2024 (i.e. next month) in the most recent generation information spreadsheet published on May 27th 2024. However, in the project’s recent June 2024 newsletter, an update was provided stating that early construction work began in December last year, and appears to show that little-to-no electrical work has commenced.
What development timeframe can we expect for new projects?
This is an important but difficult question to answer, as project scale and the speed of supply chains can vary significantly.
In March, I published a deep dive into the development timelines for each of the twenty batteries registered in the NEM. In the chart below, I’ve updated the data for the four BESS projects still in development, and have ordered the projects by completion month.
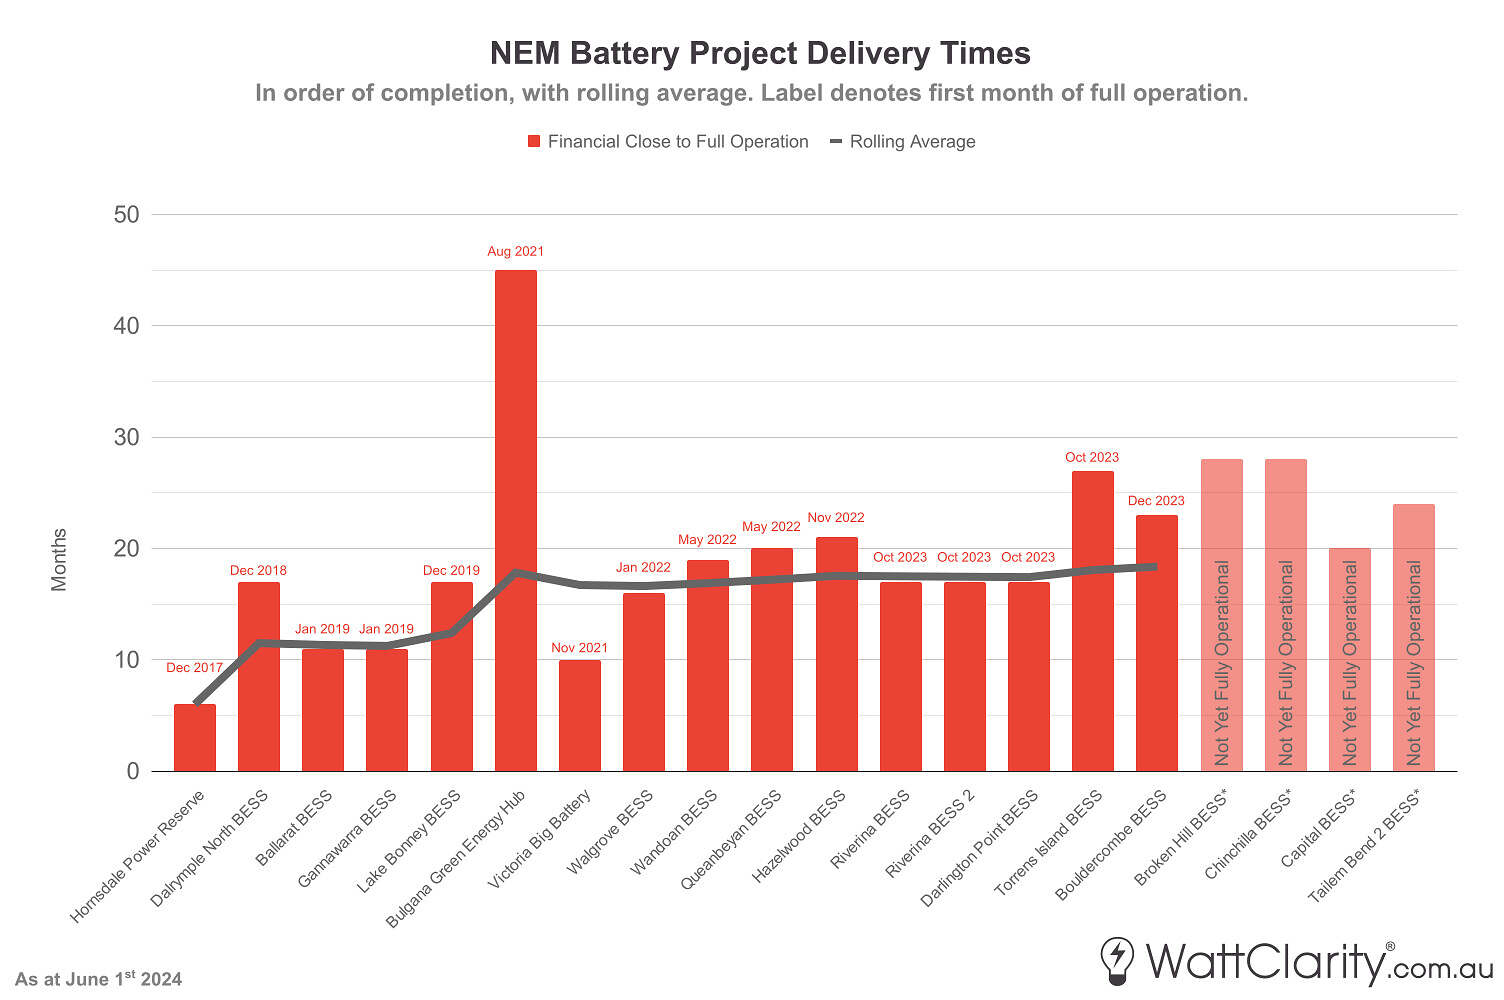
Delivery times for BESS projects registered in the NEM. The long-term trend appears to show an ongoing slowdown.
Note: A full list of references for dates of financial close and start of full operation can be found in the original article.
Judging by the post-covid trend in these delivery times, it’s not unreasonable to think that we are trending towards an 18-to-30 month expected delivery period for a BESS project to reach completion from financial close.
We should also keep in mind that projects are expected to continue to increase significantly in size (and complexity), particularly for BESS and wind projects.
Key Takeaways
Continuing on from the conclusions in Part 1, I have two final points from conducting this analysis:
- Despite the AEMO’s best efforts, the NEM lacks a sufficiently robust, up-to-date, and vetted database of new projects in development. This leads me to my second key takeaway below.
- A model can only be as good as its inputs. We should keep this front of mind when we consider and digest the big decisions that shape the energy transition.
Hydrogen plant in SA ready by the end of next year! LOL…Seriously, AEMO? A new type of power plant is going to be up and running from scratch in 18 mths? has it even reached FID yet? Even the SA government’s own website says “early 2026” which is I suspect still very optimistic.