Don’t have long this morning, but thought it worth also noting another thing that happened overnight…
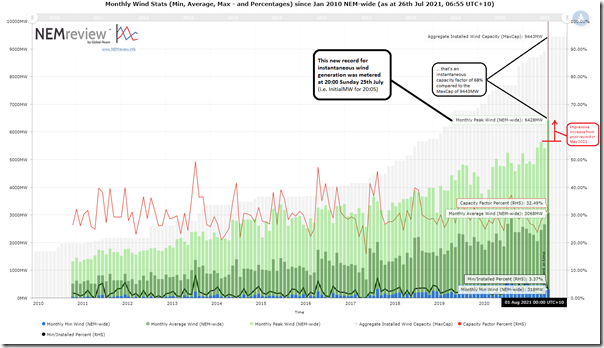
What was a record for ‘peak wind production’ on Saturday at 20:20 was no longer the case under 24 hours later, with the strong wind patterns pushing the record higher still (and by a significant uplift again) – as shown in this trend from NEMreview again:
As we see in this snapshot, ‘peak wind generation’ is now set at 6,428MW (i.e. 308MW higher than the Saturday’s short-lived record!)
This aggregate figure was metered at 20:00 on Sunday 25th July 2021 – and was constituted by:
1) The biggest contribution was still from Victoria (at 2,142MW – this was somewhat lower than see on Saturday’s peak);
2) Next biggest contribution from South Australia (at 1,696MW – this was also lower than see on Saturday’s peak);
3) A larger contribution from NSW (at 1,676MW compared to Saturday’s peak);
4) QLD contribution yesterday (at 475MW) was significantly greater than at Saturday’s peak;
5) Rounding up the places was TAS at fifth (at 439MW was also higher than Saturday’s peak).
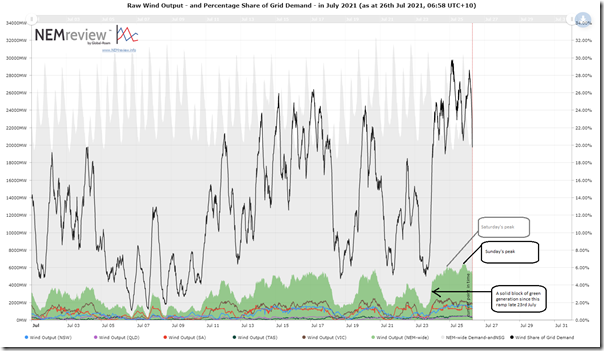
Here’s the trended granular view for wind production through July 2021, also from NEMreview:
Given the underlying weather patterns, it’s no surprise that there’s been a solid block of green present since the wind ramp event late Friday evening 23rd July 2021.


Leave a comment