Friday 1st May (a bit over a week ago) was a busy day in the NEM. Not only did it see aggregate wind production hit 5,000MW for the first time – it also saw spot prices plunge in the QLD region, not so much because of all the wind in the south, but moreso due to a number of other factors:
Factor 1 = low demand – in part because of temperature, but also because of large carve-out in grid demand due to supply from rooftop PV around the Queensland region;
Factor 2 = plentiful available generation capacity, including supplies from the large fleet of Semi-Scheduled ‘Large Solar’ plant scattered across the state.
Factor 3 = significantly constrained exports from QLD into NSW, as a result of damaged transmission in northern NSW limiting flows in either direction.
Because of the negative prices experienced through the day, a number of solar farms were operated in such a way that they curtailed generation (and so ‘spilled’ solar) at times when the market was indicating a strong oversupply of capacity.
(A) Two Non-Conformances on the day
At the end of Friday’s article, I noted that there were two solar farms separately flagged by AEMO as having been identified as Non-Conforming through periods of the day. These were as follows:
|
Yarranlea Solar Farm |
Clermont Solar Farm |
|
Market Notice 75534 explained the event: ___________________________________________________________________________ Notice ID 75534 AEMO ELECTRICITY MARKET NOTICE NON-CONFORMANCE QLD1 Region Friday, 1 May 2020 AEMO declared a schedule generating unit non-conforming Unit: YARANSF1 Auto-generated on behalf of Manager NEM Real Time Operations |
Market Notice 75535 noted the following: ___________________________________________________________________________ Notice ID 75535 AEMO ELECTRICITY MARKET NOTICE NON-CONFORMANCE QLD1 Region Friday, 1 May 2020 AEMO declared a schedule generating unit non-conforming Unit: CLERMSF1 Auto-generated on behalf of Manager NEM Real Time Operations |
|
Out of curiosity we had a look at what happened on the day with respect to Yarranlea Solar Farm, and have shared some of what we saw here with you here in this Case Study. |
When time permits, we’d also like to share some thoughts on what happened with Clermont SF in its own Case Study in the next week or two (LINK STILL TO COME). There are some similarities – but also some differences as well, so both present useful contrasts. |
For Yarranlea, the notice above indicates that the unit was Non-Conforming for a consecutive total of 19 dispatch intervals (so 95 minutes in total). This happened on a working weekday, but I am wondering* about the extent to which it being a remote location with (we presume) not many people on site contributed to this duration.
* I am not aware of the specific circumstances of this event and am only working with what data is publicly available in the AEMO’s MMS to ask these questions. Perhaps one of our more learned WattClarity readers can help me out – online or offline?
(B) Animation from 08:05 on Friday
It’s been a while since I’ve prepared one of these, but there are some prior ‘animations’ linked under that tag on WattClarity.
In this case we walk through a 4.5 hour period beginning 08:05 (so over 2 hours prior to the event) as there are things visible then which add to the questions I have about this particular day – and others I have seen like these on other sites as well. Very interested in your feedback, if you can help me understand!
It’s also worth re-iterating some of the reasons why we significant invest time in delving into specific instances through case studies like these (some of which make their way onto WattClarity).
Do you know of others who can help us expand our capability?
(C) Specific comments
In the animation above I highlight some particular developments, which I expand on further below…
(C1) Operational since early January
… firstly, however, it’s probably useful to highlight this background to how the plant has operated in the months before Friday 1st May.
The Yarranlea Solar Farm only began to output power to the grid during commissioning earlier in 2020. As such, there was no data to report for this plant in the Generator Statistical Digest 2019, though we will look forward to adding two pages for this unit into the next annual update:
(a) to be compiled with data to 31st December 2020; and
(b) released early next year.
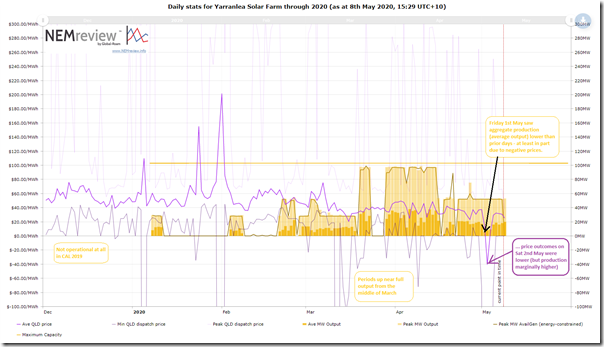
Using this trend query produced in NEMreview v7 we can see the following pattern of daily performance stats for the unit:
We can see the unit commence operations in early January and achieve close to full output on each of 21 days between mid-March and mid-April. Peak output has dropped back to only 53MW in recent weeks.
(C2) Several observations about the frequency and form of the rebidding
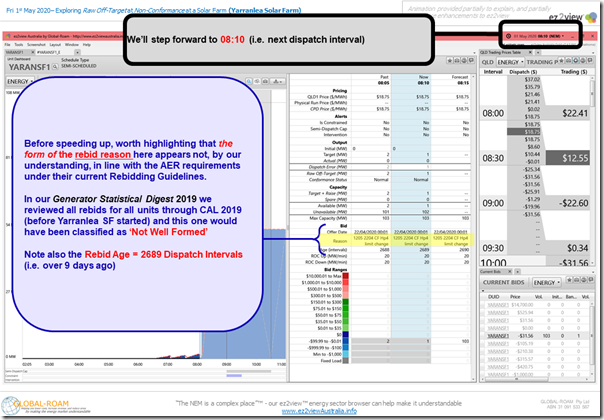
Before we reached the period of the Non-Conformance itself, I highlighted that the form of the bid that was active through the whole of the day was classified by our automated parsing logic as ‘Not Well Formed’:
Since 2009 the AER has been quite prescriptive about the form it expects rebidding to take.
2) Our understanding of the reasons for this prescriptiveness is that the AER believes it is required in order that:
(a) The AER can fulfil its requirements to ascertain that the bids made, and the time at which they are made, are not ‘false or misleading’; so that
(b) The dispatch process operated by AEMO in real time can be a true reflection of the balance between supply and demand; and so that
(c) Other Market Participants can rely on interpretation of bids and rebids made by others (on a ‘next day’ basis) to better understand opportunities emerging in the market.
3) Readers (particularly wholesale participants) should be aware that the AER Guidelines will also change with the start of 5 Minute Settlement (which is currently scheduled for 1st July 2021, but which might be delayed by a year). These changes are all focused on further strengthening requirements to provide useful information to the AEMO, and to the market more broadly.
Throughout the Generator Statistical Digest 2019, we automatically parsed each of the rebids made by all DUIDs through 2019 and categorised these using the AER’s current categories to provide a quick guide to the level of responsiveness of each access (and a sense of how closely the units adhered to the structure of the rebid requested by the AER) in the ‘B’ Pages* for each unit in the GSD2019.
* again note that there’s no data for the Yarranlea Solar Farm in the GSD2019 as it was not operational through 2019.
The particular form of the bid that was active for Friday 1st May:
Observation #1) Was initially received at the AEMO at 00:01 on Wednesday 22nd April, for first dispatch at the start of the market day beginning 04:05 on Wednesday 22nd April (i.e. was a Rebid)
Observation #2) Was ‘Not Well Formed’ with respect to the AER’s proposed rebid structure, as noted below.
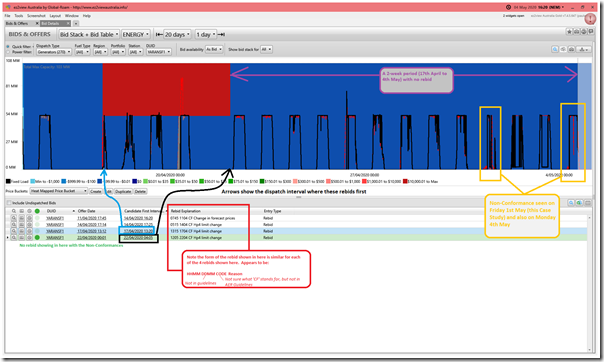
Observation #3) This rebid updated a prior bid placed on 17th April at 13:12 (i.e. itself a rebid), but had not been updated since that time though until at least Monday 4th May (time of the snapshots below).
(3a) Specifically, there was no rebid placed to update details of whatever issues were in place that might have been contributing to the Non-Conformance on Friday 1st May – which we can see in the ‘Bids & Offers’ snapshot here:
(3b) We note that 17th April was two weeks prior to 1st May, hence we understand why the ‘Bid Age (intervals)’ was shown as over 3,500 dispatch intervals in the animation.
i. Whilst this is not totally unique amongst DUIDs, it does indicate that this unit is not an active bidder in the NEM (at least at this point);
ii. In contrast, readers might compare this to the much more active rebidding behaviour shown through in this Case Study of Clermont Solar Farm (LINK TO COME) focused on the same day (Friday 1st May) and very similar broader conditions.
iii. I’m not stating, in this contrast, that one approach is ‘better’ than the other (as each have their own challenges, as we will see). Rather just to highlight that there are different approaches that participants might consider.
Observation #4) Compared to the prior bid (on 17th April) through the ‘Compare Bid Details’ widget in ez2view above, we note that the unit had offered more capacity down at the –$31.56/MWh (Bid band #6):
(4a) Useful to note that the prices in these bid bands had not changed from 17th April through until (at least) Monday 4th May (remember they can change each day, if the participant wants). This reinforces the “not a very active bidder” typecast.
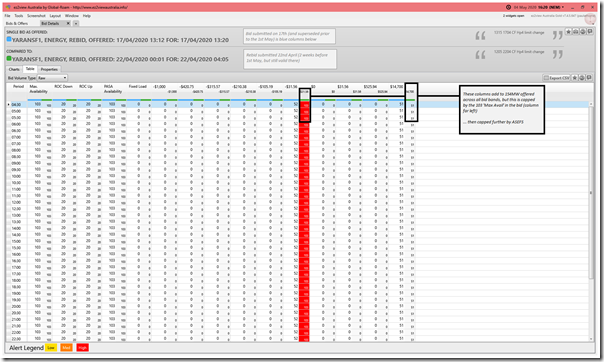
(4b) Also useful to use the following tabular view of the Bid submitted on 22nd April to highlight that the total capacity bid was 154MW which is more than the Maximum Capacity of the station – however:
i. that is trimmed for all units (Scheduled and Semi-Scheduled) by the ‘Max Avail’ in the bid
ii. and then further (for Semi-Scheduled Solar Farms like this one) by the Availability produced out of ASEFS, or by the self-forecast if that was submitted in an approved manner by the Participant.
(C2) Problems getting started in the morning
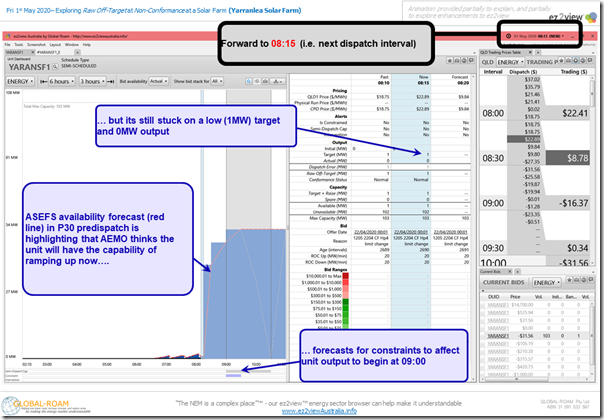
In the 08:15 we noted in the animation that it appeared that the solar farm had some difficulties getting started for reasons that can’t be discerned directly in the data:
Observation #5) We see that the Availability forecast in P30 predispatch suggested that AEMO thinks the plant could be at 41MW by the end of the 08:30 Trading Period (or at least did, when the forecast was published at 08:01 approximately). However we see that as at 08:15 it was still struggling to even get off 0MW.
(5a) Unfortunately there is insufficient data in the publicly available data for us to really understand what’s going on here – which invites people to guess (something I’m not comfortable doing here – especially publicly in this article).
(5b) This situation is further complicated by the fact that the ‘old’ P5 predispatch forecasts for that day should be (according to the MMS Data Structure) ‘next day public’ – but are not, for unknown reasons:
i. The AEMO (for reasons unknown) only bundles these up on a batch basis to only publish them some weeks later.
ii. Hence we can’t know at this point if AEMO was revising its availability forecast down through the 08:30 trading period in the light of some very apparent problems Yarranlea had on this day in getting itself online.
iii. Also note no rebid from the plant to suggest any technical issues.
(5c) This is not the first time we have seen Semi-Scheduled solar farms experience these sorts of problems. Do you know of people who can help us understand?
Observation #6) Also in the snapshot above we highlight that the AEMO P30 forecasts were indicating the likelihood that the unit would have soon been subject to both:
(6a) Transmission constraint (#YARANSF1_E) for the single Trading Period ending 09:00 (limiting its output to no more than 52MW); and then
(6b) From the Trading Period ending 09:30, being ‘dispatched down’ as a result of the price forecast dropping to –$31.56/MWh (the bid price for the unit – i.e. meaning it was forecast to be the marginal unit).
(6c) In both of these occasions (i.e. being ‘constrained down’ and then being ‘dispatched down’, the Semi-Dispatch Cap flag was forecast to be ON, notifying the unit to pay attention to the dispatch targets).
(6d) As we know, however, the situation that arose was somewhat different to this…
(C3) Unit being ‘dispatched down’ because bids are expensive
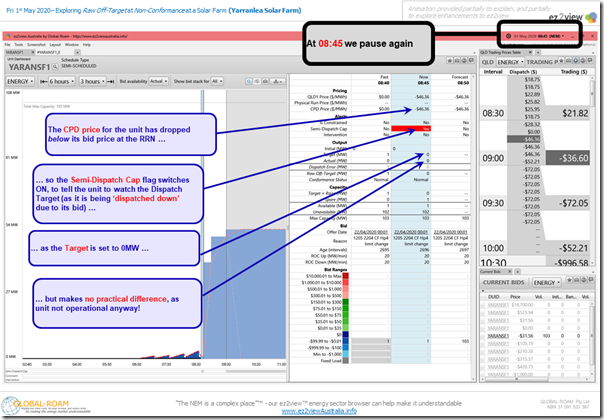
In the snapshot from 08:45 we noted how the Connection Point Dispatch Price (i.e. ‘CPD Price’) for the unit had dropped below the bid price for the unit :
Observation #7) As noted in Observation #6 above this had been forecast to occur in the half-hour beginning 09:00 but instead had occurred first fifteen minutes earlier (at 08:45 on the day):
(7a) This was 15 minutes earlier than forecast using the P30 forecasts
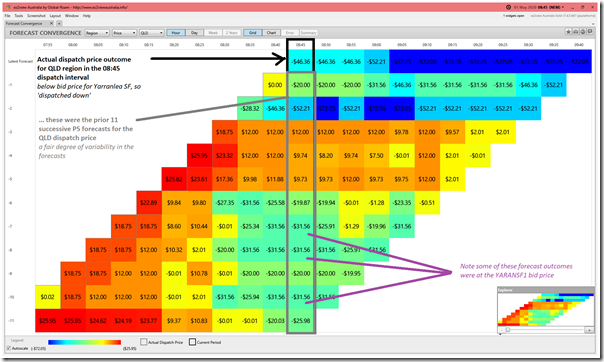
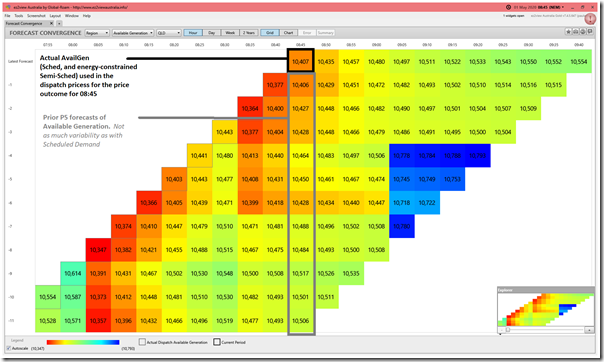
(7b) However reviewing prior P5 price forecasts with the ‘Forecast Convergence’ widget in ez2view we see that the price forecast for 08:45 had been bouncing considerably over the prior hour:
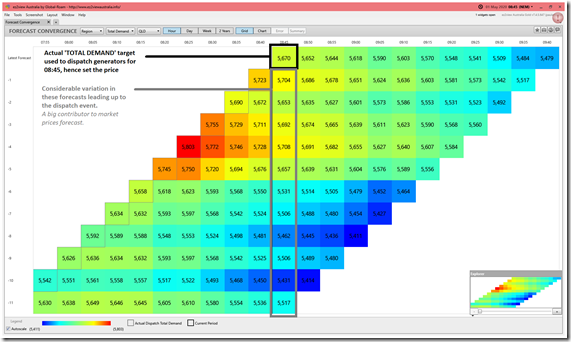
(7c) Flipping ‘Forecast Convergence’ to look at the analogous data points for ‘TOTAL DEMAND’ (i.e. Scheduled Demand) for the region, we see that there was a fair degree of variability on the demand forecast for 08:45 as well
i. approaching 300MW difference between the lowest forecast for Market Demand and the highest
ii. goes a long way to explaining why the price forecast jumped around as much as the above.
(7d) Flipping ‘Forecast Convergence’ once more to look at the analogous data points for ‘AVAILABLE GENERATION’ (i.e. for Scheduled and Semi-Scheduled Generators) for the region, we see that (at least compared to the forecast for Total Demand) there had been much less variability here – though note that this shows availability at any price, and does not show how bids might have changed for all this capacity.
(C4) Large positive ‘Raw Off-Target’ when unit starts
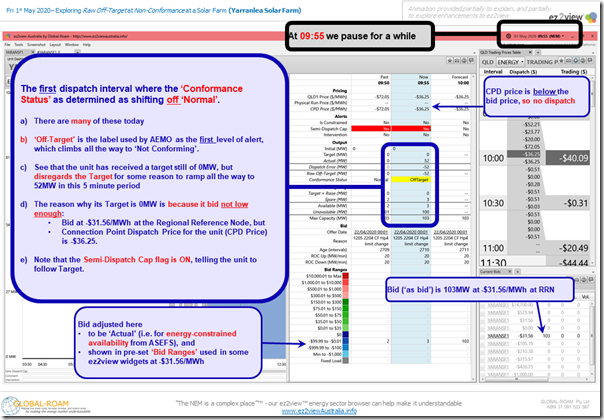
At 09:55 we highlighted how a large negative ‘Raw Off-Target’ arose as a result of the unit ramping unexpectedly from 0MW to 52MW in the dispatch interval, without a Target:
Observation #8) This is an example of the type of over-performances tabulated for each DUID for all months in the Generator Statistical Digest 2019:
(8a) It was also discussed in summary form (i.e. large deviations of more than 30MW in positive or negative form) for all DUIDs in this article of 28th January 2020.
(8b) Further exploration of these large excesses was performed last Tuesday for ‘all coal’ and ‘all wind’ aggregations through 2019.
(8c) In this case, the 52MW added to the supply side of the equation in this dispatch interval was unexpected by NEMDE, and so will play a role in the cost of balancing services procured by AEMO to cater for unexpected situations like these.
(8d) On a more direct basis for this particular DUID, having its ‘Conformance Status’ jump from ‘Normal’ to ‘Off-Target’ is something all operators seek to avoid wherever possible
(C5) Non-Conformance on Friday 1st May
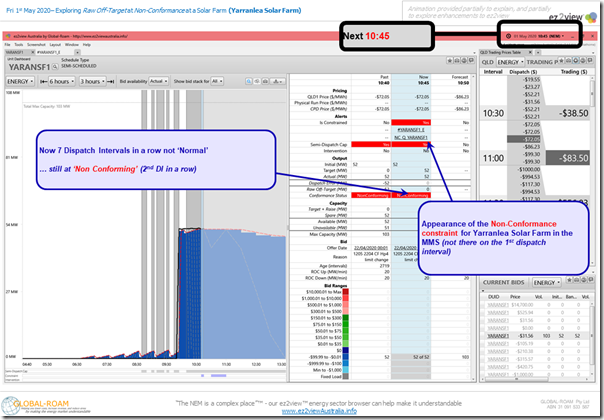
At 10:40 the code in ez2view mimicking* AEMO’s ‘Conformance Status’ logic ascertains that the unit will have been declared ‘Non-Conforming’ for the first time that day.
* in noting that the logic in ez2view ‘mimics’ the AEMO’s we have followed published operations procedures in building the algorithm, and do periodically check discrete instances we see with the relevant participant (though not in this case before publishing this article).
i. Hence we have some confidence that the code is correct.
ii. However as the relevant Conformance Status table is never made public, we cannot check ourselves in all circumstances.
iii. Readers should keep this in mind.
In the subsequent dispatch interval in response, we see that a Non-Conformance constraint has been applied to the unit:
The Non-Conformance constraint is basically AEMO’s way of saying:
‘well, the unit’s not responding to the targets NEMDE sets for it – so we will just assume it continues to run at the same level (even though it shouldn’t be) to enable the supply/demand equation in NEMDE to get back into balance’.
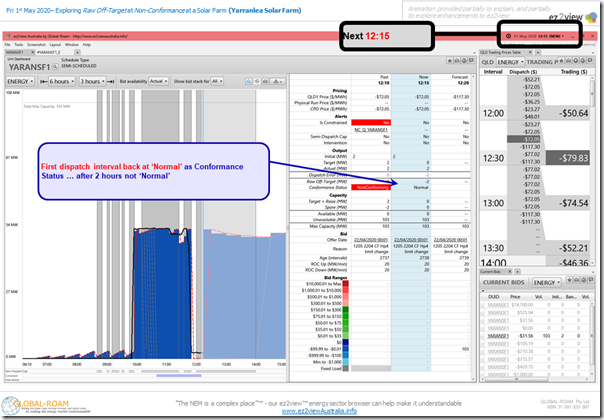
Observation #9) We see that the Non-Conformance status was finally removed at 12:15 (i.e. after 2 hours with the ‘Compliance Status’ away from ‘Normal’ – i.e. 24 dispatch intervals in total):
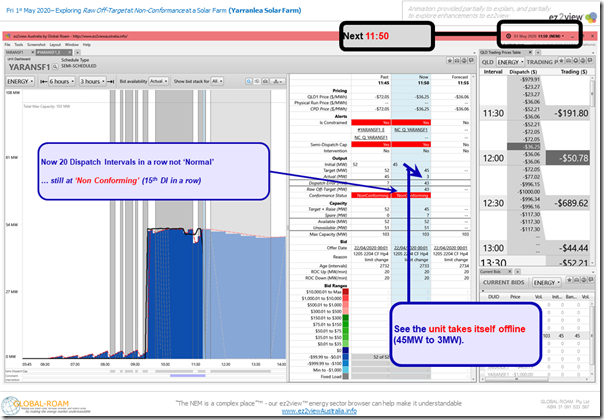
Observation #10) Before this happened, however, we noticed that the unit had managed to switch itself off in the 11:50 dispatch interval:
(10a) Remember that this is still what was implied in the bids;
(10b) See above that the CPD Price for the 11:50 dispatch interval (-$36.35/MWh) was below the bid price for the unit’s capacity (-$31.56), so the unit was saying the price was too low for it to be worthwhile running.
Reminder #11) Readers should also be aware we are exploring some deeper questions on the scalability and sustainability of the Semi-Scheduled category itself (or at least the way it currently operates) as part of broader questions about how ‘NEM 2.0’ might function.
(C6) Similar Non-Conformance three days later
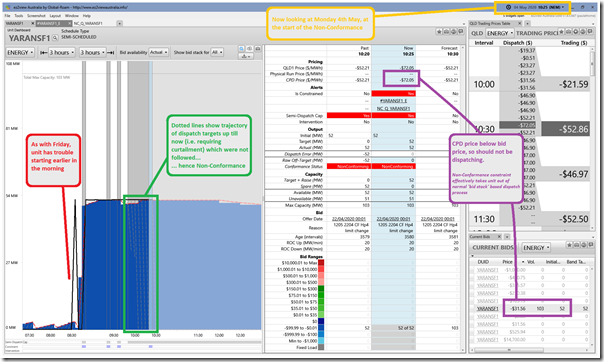
Whilst on the topic of Non-Conformance at Yarranlea Solar Farm, it’s worth noting that that the AEMO also pinged the DUID with a very similar Non-Conformance three days later (on Monday 4th May) as well – seen here in Market Notice 75563:
______________________________________________________________________________
Notice ID 75563
Notice Type ID Details of Non-conformance/Conformance
Notice Type Description MARKET
Issue Date Monday, 4 May 2020
External Reference NON-CONFORMANCE Region QLD1 Monday, 4 May 2020
______________________________________________________________________________
AEMO ELECTRICITY MARKET NOTICE
NON-CONFORMANCE QLD1 Region Monday, 4 May 2020
AEMO declared a schedule generating unit non-conforming
Unit: YARANSF1
Duration: 04/05/2020 10:20 to 04/05/2020 12:00
Amount: 52 MW
Constraint: NC-Q_YARANSF1
Auto-generated on behalf of Manager NEM Real Time Operations
Here’s a snapshot of the the 10:25 dispatch interval on Monday:
—————–
That’s all I have time for in this article today…


Leave a comment