Back in the office this morning, following on from Thursday evening’s shenanigans in the NEM (mainly focused on VIC and SA), I’ll take a brief look this morning at what we can see in relation to what’s forecast to happen later today.
I do have some ‘real work’ to do during the day (i.e. things directly for clients who pay our bills by licensing our software, and also increasingly by subscribing to highly valued reports like the GSD2019 following on from the GRC2018). Thanks to all of those clients who support us – to the point where we can provide this WattClarity service.
Perhaps I will have time to check back on this later…
(A) Expectations for peak demand this evening
A number of mainstream media outlets picked up on my comments yesterday morning (or tweeted Wednesday) that this evening’s NEM-wide Scheduled Demand was forecast to be up over 34,000MW (which is a level it’s rarely reached in prior years).
In the AFR, Angela MacDonald-Smith wrote about “Power grid back in crisis as heat returns”
In the Australian, Perry Williams wrote about “Scorching heatwave to test power grid as demand soars”
In the Age (hence SMH), Nick Toscano wrote about “East coast heatwave threatens national power grid”
… there might have been others, but I have not checked.
Early this morning I tweeted that the demand forecast for today was considerably higher than what I had seen approximately 36 hours beforehand which, when coupled with the higher-than-forecast peak in demand experienced yesterday across the NEM, makes me a little nervous!
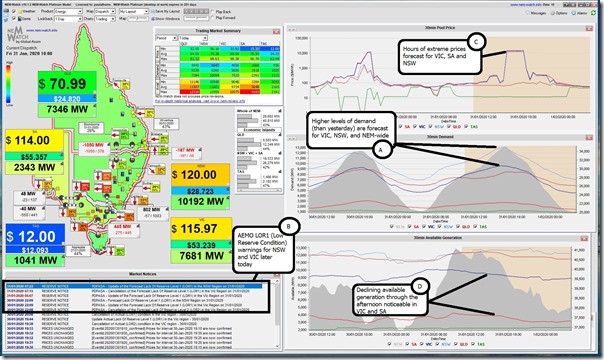
This snapshot from NEMwatch v10 for the 10:00 dispatch interval (NEM time) can be seen to highlight a four points of interest, which are discussed in turn here:
First point to expand on is that the AEMO is forecasting that levels of Scheduled Demand will be higher those (already high) levels experienced yesterday in the Victorian region, in the NSW region, and also for the whole of the NEM.
(A1) Whole of NEM demand
In the 10:00 snapshot from NEMwatch above, we see that the AEMO was forecasting the NEM-wide Scheduled Demand would be 34,940MW in the half-hour ending 17:00 (trading period).
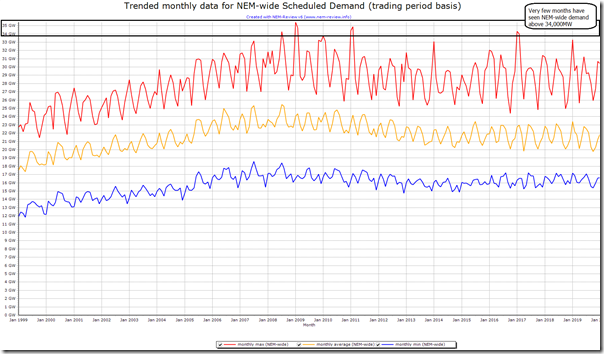
In yesterday morning’s article I included this image from NEMreview v6 to illustrate how rarely the NEM-Wide Scheduled demand exceeded 34,000MW (i.e. in only 7 months previously over 252 months since the start of the NEM, and not (until yesterday) in the three years since summer 2016-17.
We can also see how many of those 7 months saw demand level up near 35,000MW (as is now forecast for this afternoon):
What is especially remarkable in this result is that Scheduled Demand is nett of all the ‘behind the meter’ generation supply, and also net of Non-Scheduled (but registered) generation supply:
(a) This ‘behind the meter’ generation supply is primarily (though not only) rooftop PV injections
(b) Eyeballing APVI’s updated estimates for NEM-wide contribution, yesterday this was:
(i) a little more than 5,000MW contributing during the zenith early afternoon yesterday (some hours before the real trouble started);
(ii) and (though well reduced) still significant at the times of peak in Scheduled Demand (approx 2,000MW at 17:00 and approx 1,000MW at 18:00).
(c) Mentally adding this back in, this means that (compared to the peak all-time record for demand set on 29th January 2009, before the solar boom) yesterday’s peak in demand could perhaps be considered a ‘new all time record’ on a like-for-like basis (remembering the gory details of all the different measures of ‘demand’)
So if yesterday’s level of underlying demand experienced (i.e. adding back in ‘behind the meter’ contributions) might have been an all-time record, then today’s seems set to be off the charts…
(A2) Demand for VIC Region
In the 10:00 snapshot from NEMwatch above, we see that the AEMO was forecasting the VIC Scheduled Demand would be 9,566MW in the half-hour ending 17:00 (trading period).
Now historically the peak demand seen in the VIC region (on the same basis – Scheduled Demand Target) was 10,496MW (back when?). Hence we can understand that this afternoon’s temperature forecast would be delivering a peak in demand in Victoria less than 1,000MW off the all-time record.
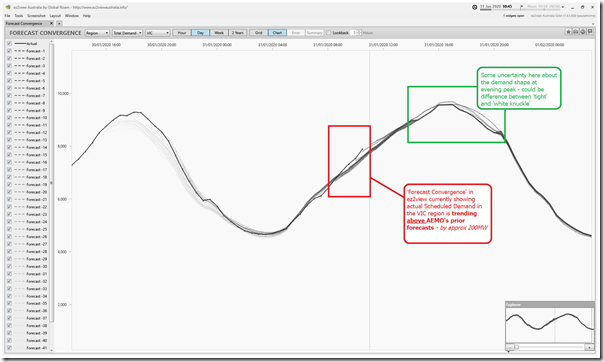
Using ‘Forecast Convergence’ widget in ez2view, we can see here that currently (i.e. in the 10:45 dispatch interval in this snapshot) the demand this morning is currently tracking about 200MW above the AEMO’s preceding forecasts:
What will happen this evening?
(A3) Demand for NSW Region
In the 10:00 snapshot from NEMwatch above, we see that the AEMO was forecasting the NSW Scheduled Demand would be 13,051MW in the half-hour ending 16:30 (trading period).
Now historically the peak demand seen in the VIC region (on the same basis – Scheduled Demand Target) was 14,649MW (back when?) – meaning that today’s peak in demand is expected to be within 1,500MW of the all-time record.
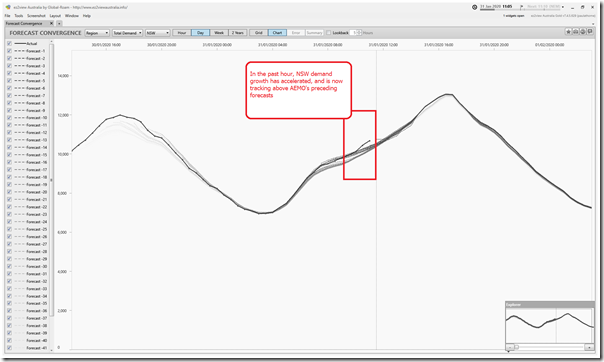
Using the same ‘Forecast Convergence’ widget in ez2view to flip to demand for NSW in the 11:05 dispatch interval and we see that NSW demand growth has accelerated, and is now also tracking above AEMO’s forecasts:
Whether this continues through the afternoon is yet to be seen (this last hour might have been due to cloud cover suppressing rooftop PV – I have not checked). But it is an important consideration for those responsible for ‘Emergency Management’ – who surely should have something like ‘Forecast Convergence’ in ez2view set up for their own visibility…
(B) AEMO’s warnings for today
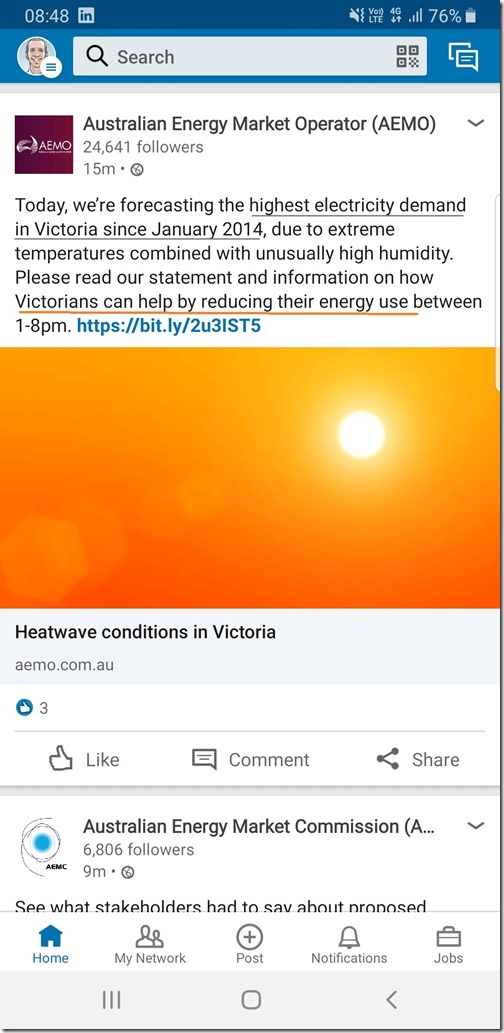
After being (surprisingly, even?) quiet earlier yesterday with what was unfolding on Thursday evening, the AEMO has ‘hit the airwaves’ more publicly early today with messages I saw on LinkedIn and also on Twitter:
More directly to market participants, the AEMO has issued a number of market notices – some of which were included in the snapshot form NEMwatch at 10:00 at the top of this article. Those were with respect to forecasts for LOR1 (Low Reserve Condition) in NSW and VIC this afternoon.
As I type this, we see that Market Notice 73168 has been issued speaking about extreme temperatures for today in VIC, and tomorrow in NSW, and in QLD on Monday:
Notice ID 73168
Notice Type ID Subjects not covered in specific notices
Notice Type Description MARKET
Issue Date Friday, 31 January 2020
External Reference Market reporting for forecast extreme temperature in the Latrobe Valley area on 31/01/2020 and New South Wales region on 01/02/2020 and elevated temperatures in Queensland on 03/02/2020
________________________________________________________________________________________________
AEMO ELECTRICITY MARKET NOTICE
Refer to AEMO Electricity Market Notice 73065
AEMO’s weather service provider has issued forecast temperatures for Latrobe Valley area and New South Wales (NSW) region that are equal to or greater than the Generation Capacity Reference Temperatures:
Latrobe Valley
On 31/01/2020: Maximum forecast temperature 43 degrees C at Traralgon for the Latrobe Valley area.
NSW
On 01/02/2020: Maximum forecast temperature 42 degrees C at Bankstown for the Sydney area.
Also, note that elevated temperatures are forecast in Queensland region on 03/02/2020.
Further updates to this advice may not be provided.
AEMO requests Market Participants to:
1. review the weather forecast in the local area where their generating plants are located and,
2. if required, update the generation levels in their dispatch offers consistent with the forecast temperatures.
Details on Generation Capacity Reference Temperatures can be accessed using the following link to AEMO website:
http://www.aemo.com.au/Electricity/Planning/Related-Information/Generation-Information
Generation Capacity Reference Temperatures:
QUEENSLAND – BRISBANE AREA 37 degrees C.
NEW SOUTH WALES – SYDNEY AREA 42 degrees C.
VICTORIA – MELBOURNE AREA 41 degrees C.
SOUTH AUSTRALIA – ADELAIDE AREA 43 degrees C.
TASMANIA – GEORGE TOWN 30 degrees C.
BASSLINK- (Latrobe Valley Airport 43 degrees C AND GEORGE TOWN 33 degrees C)
AEMO Operations Planning
Remembering that AEMO had needed to take the remarkable* step of pleading to owners of Semi-Schedule plant in the NEM (i.e. wind farm and solar farms)
* perhaps “downright embarrassing” would be a better term, given indicating some generation participants in the market were just asleep at their wheels, and unaware of their obligations (or lacking knowledge of how to comply).
I do hope that all generators in VIC and NSW and QLD all give the AEMO all the assistance they are requesting in the Market Notice above. The reason why this is important should be startlingly clear below in (D)…
(C) Sky-high prices forecast
Should not need much discussion that, especially for an energy-only market using bid-based dispatch at times of tight supply and demand we want to be seeing sky-high prices, as this is the signal for Generation Participants to dispatch plant, and for Energy Users with spot exposure to deliver their form of Demand Response:
I would expect that many of our Energy User clients would have been yesterday, and will again be today
This is a very good thing that needs to be encouraged more (not dissuaded), because it helps to keep supply/demand in balance, and delivers large C&I energy users lower average cost of energy than it would have otherwise been.
However, i noted yesterday that these facts did not stop the usual collection of conspiracy theorists shouting about how ‘criminal’ it was that prices could spike so high.
Enough said about that…
(D) Aggregate supply capability
The final point noted in the 10:00 snapshot from NEMwatch was how the AEMO was forecasting that available capacity from all (Scheduled and Semi-Scheduled) plant in both the VIC and SA regions would decline noticeably through the afternoon. That’s not a great combination in coincidence with sharply rising demand up towards the all-time record on a very hot day.
At least part of the reason for this will be due to high temperature limitations on plant – pretty much all* plant (coal, gas, wind, solar, etc…) is adversely affected in various ways.
* The specifics of this would be subject for another, more focused article, at another time – given the level of confusion and (deliberate, even?) misinformation being pushed by various vested interests with their own axes to grinds.
Those who want to see objective data for all 304 units operating in the NEM are welcome to pick up their own copies of the Generator Statistical Digest 2019 for only $750exGST (less if you have the GRC2018)
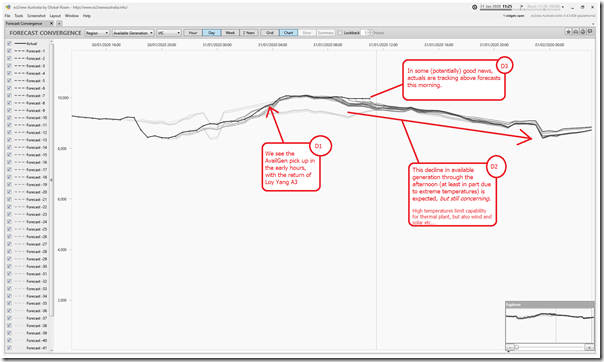
In aggregate, again using the same ‘Forecast Convergence’ widget in ez2view – but flipping to look at Available Generation for the Victorian region, we see three main things:
(D1) Loy Yang A3 has returned
Loy Yang A3 (which tripped at an inopportune time yesterday) returned early this morning. We can see the effect in the step change in the forecasts.
(D2) Available Generation forecast to decline
Due to the high-temperature limitations on all plant, aggregate available generation for Victoria is forecast to decline significantly.
But at least the AEMO’s forecasts seem fairly stable at this point, not getting worse…
(D3) Actuals tracking above forecasts
… indeed in some good news (we hope) it appears that actuals are tracking above forecasts for the VIC region.
(D4) A lot riding on the timing of the decline in wind and solar
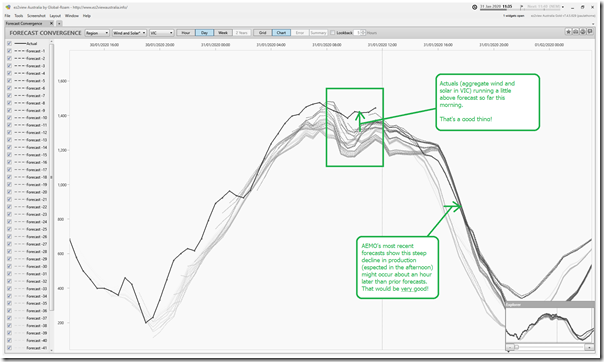
A final note, in flipping to look at AEMO’s aggregate forecast for the contribution of wind and solar in the VIC region is that it is tracking slightly above forecast currently – and (perhaps more encouragingly) the AEMO is forecasting the rapid afternoon decline might occur an hour later than they were forecasting earlier:
That would be a very good thing – however note that this outcome would be, to a large extent, uncontrollable. Not much we can do here but wait…
(E) Russian Roulette
Remembering my use of the ‘six shooter analogy’ for (hopefully) illustrating the difference between probability and consequence some months ago, it’s probably beneficial to reflect on the fact that – in essence – the NEM is now playing Russian Roulette with more loaded chambers than used to be the case in some prior years (perhaps since the closure of Hazelwood particularly in the VIC region, and lack of replacement with the same level of dispatchable capacity).
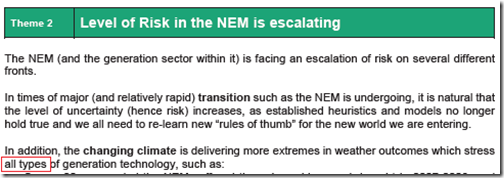
Most times, still, the trigger pulls and the chamber is empty. However as we explained in some detail through the Generator Report Card 2018 it is a higher risk environment we’re operating in:
Some of the reasons for this heighted risk, some might argue, are beyond our control – however we’ve been pretty direct before that there are a number of villains in this evolving train-wreck of an energy transition.
… so if it does occur this afternoon/evening that the trigger is pulled and the chamber is – unfortunately – loaded, one of the best things that could happen would be those villains at both end of the Emotion-o-meter so quick to apportion ‘blame’ on the basis of scant/selective ‘facts’ would collectively decide to put a sock in it….


What do you think caused the 700MW drop at 13:30 NEMTIME?
will get to that…
It looks like Snowy was holding back a bit to me. Curious stuff!
Hold the phone “The Heywood interconnector linking Victoria and South Australia was cut at 1.24pm”
What do you think caused the 700MW drop (VIC) at 13:30 NEMTIME?