The hot flash experienced in southern Australia last week (as reported on WattClarity last week) arrived in Queensland today and drove demand high (but not close to the historical maximum levels).
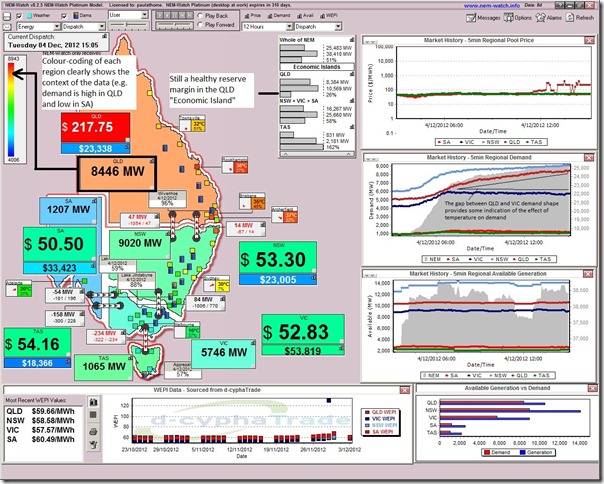
This snapshot taken from NEM-Watch at 15:05 shows demand pushing towards the 8,500MW mark:
The price chart (in the top right of the NEM-Watch display) shows how prices in QLD have bumped around the range $100/MWh to $400/MWh for much of the day but, despite the presence of the 855-871 constraint* and lots of generator output changes, have not “popped” to the stratospheric levels seen on other occasions (at least at the time this post was written).
The colour-coding* of each of the regions in the display provides a clear indication of how QLD was approaching the “red zone” on the day – whereas in contrast the demand in South Australia was astoundingly low (due to the very modest temperatures seen in the state).
When taken together, this meant that the NEM-Wide demand barely rose above 25,000MW – so fully 10,000MW below the all-time record set back in summer 2008-09.
* in NEM-Watch, the colour coding provides context for the price and demand data (red is high & blue is low) that is aligned to its intended purpose as an entry-level dashboard to what’s happening in real time in the NEM. For those who want more details, please give us a call (07 3368 4064) to speak with us about ez2view, the interactive two-screen dashboard for traders, operators and expert analysts. Amongst other things, ez2view provides a clear understanding of the nature of transmission constraints (such as the 855-871 which was described last summer)
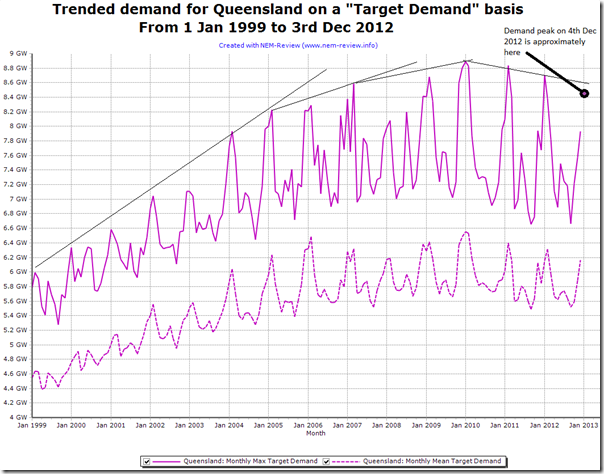
To provide some context to this QLD demand spike, we prepared this analysis through the use of NEM-Review that shows a trend in peak and average demand in QLD each month since the start of the NEM:
We were quoted in this AFR article over the weekend with reference to the high demand in Victoria last week as noting it was a “new paradigm” because of the variety of factors putting downward pressure on electricity demand across all periods of the day.
In the light of all these factors working to suppress demand, it can be seen that the level of demand experienced today in QLD was indeed quite high.
However, as a final note we’d caution that the record demand levels experienced in summer 2008-09 also surprised most people because of the several years beforehand where demand growth had been seen to be slowing.


Paul,
Interesting times indeed. There were years not so long ago where a little price excursion such as $217/MWh would not have merited a post here.
Interestingly, this price would not even be able to trigger the $300 strike price of the ASX d-cyphatrade futures cap. Perhaps we will see a revival of $100 strike caps as a standard hedge instrument now that this is looking like a more sedate norm for the market.
On the other hand, the underlying structure of the market has not changed and all that is required is a few more plant retirements to bring the supply-demand balance back to something that can again generate price excursions in the $1000’s on a regular basis. I know we had one in VIC last week so they do still happen.
Thanks Ariel
Interestingly, it was only 5-10 minutes after posting this that the price did spike (about $1600/MWh in the 16:35 and 16:40 dispatch intervals).
It’s overly simplistic, but one might say that “all it took” was for the demand to rise a little bit more (to 8490MW – so about 45MW higher than it had been prior to that, much smaller than the plant retirement you proposed).
Regards
Paul