Today is Wednesday 26th June 2024, which means we’re counting down the days till the end of 2024 Q2. Already in the past few days we have looked at electricity volumetricproduction contributions (i.e. MWh as a volume) through the quarter for a variety of sources:
1) On Saturday 22nd June we posted ‘Where’s the wind gone, through 2024 Q2? … with June perhaps even worse than April or May!’, which …
(a) showed that the aggregate production of wind farms in 2024 Q2 might be worst since 2017 Q2; and also
(b) understandably has generated some discussion in various locations.
… Dan’s going to follow on from that with an animation of Q1 and Q2 shortly, so readers can understand more
2) On Sunday 23rd June we posted ‘A similar trended view of the aggregate production from Hydro Discharge across the NEM through 2024 Q2’, which:
(a) Showed that hydro production levels were also low in 2024 Q2 compared to other comparable periods;
(b) But has not garnered anywhere near the same attention
3) On Tuesday 25th june we posted ‘A similar trended view of the aggregate production from Gas-Fired Generation across the NEM through 2024 Q2’ which showed a two-speed process through Q2:
(a) A slow start to the quarter, in terms of production volumes;
(b) But then in June (and particularly from 12th June – so 7 days prior to AEMO publishing their ‘East Coast Gas System Risk or Threat Notice’) production volumes from gas-fired generation ramped up significantly, to be equal highest rate over the past 10 years.
About Coal…
Now let’s move onto coal – with the caveat being I’ve not much time today, so there are threads in what follows that remain unexplored. In the analysis we cover the 10-year span from 2015 to 2024 ytd, so it’s useful to highlight 3 significant events in this period:
1) Most readers will recall that Hazelwood Power Station closed (with only short notice to the market) in April 2017.
2) Likewise, readers will recall that Liddell Power Station closed:
(a) One unit in April 2022
(b) The remaining three units through April 2023
3) Also that the 2022 Energy Crisis occurred due to a number of different factors, with one being poor coal fleet availability during the period April-June 2022.
… and indeed that ‘Unavailability of coal units hits 24% across calendar 2022’ (though it has improved somewhat since that time).
Production from coal-fired power stations through 2024 Q2 (to 26th June)
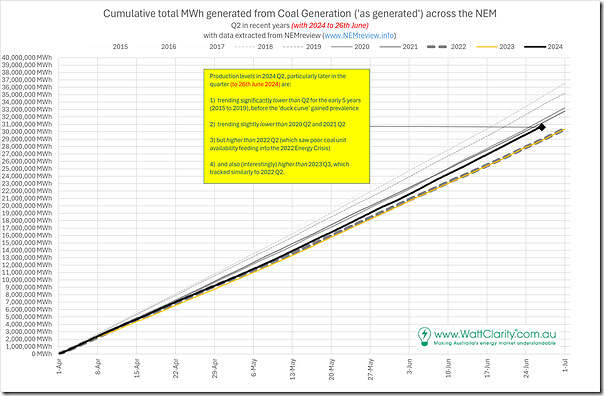
With those three key events in mind, let’s review production volumes from the coal units collectively through Q2 across the 10 most recent years, including this one:
With respect to this chart, some quick observations:
1) We’ve deliberately maintained the same y-axis grid spacing (i.e. steps of 1TWh = 1,000GWh = 1,000,000MWh) as used earlier for Wind in Q2, Hydro in Q2, and Gas in Q2
(a) from this we can see the larger scale of the numbers for quarterly production volumes
(b) Given that today we see the release of the 2024 ISP, a useful reminder of the large size of the energy transition challenge remaining for the NEM.
2) In terms of production volumes through 2024 Q2 to date, we see (extrapolating forwards by eye) that:
(a) That 2024 Q2 is 3TWh-6TWh lower through each of the 2015-2019 years
… which were before rooftop PV really started cranking, accelerating the ‘duck curve’
(b) In the 5 most recent years (2020-2024), however, we see:
i. Production volumes are significantly higher than the poor performance of 2022 Q2 (perhaps up by 1.5TWh – 2TWh), which is understandable
ii. But not as expected was that production volumes in 2023 Q2 are almost identical to 2022 Q2 (and so below 2024 Q2)
iii. Production volumes in 2024 Q2 are down on both 2021 Q2 and 2020 Q2
So, using the eye to extrapolate forwards, perhaps ~1TWh lower than 2020 Q2 (and not as large a gap to 2021 Q2) … but without the use of the (now closed) Liddell units.
This suggests that, in aggregate, though there have been some coal units experiencing forced outages through Q2, as a fleet has performed reasonably well in 2024 Q2 (compared to the 4 most recent years, and particularly 2023 Q2 and 2022 Q2). Indeed useful to highlight that:
1) When analysing Wind Production through 2024 Q2 we wrote…
‘eyeballing the chart it should be relatively easy to see that 2024 might be as much as 3,000,000MWh ‘short’ of wind production through 2024 Q2 compared to what some might have expected’
2) When analysing Hydro Production through 2024 Q2 we wrote…
‘that production levels from hydro in 2024 Q2 look such that (if the trends continue) they might end up the second lowest of the 10 years selected.’
… with (eyeballing to extrapolate) production volume in 2024 Q2 perhaps ~1.5TWh lower than in 2022 Q2 (when hydro helped cover for coal’s foibles)
3) In contrast with the results shown for coal (up 1.5TWh to 2TWh on 2022 Q2 and 2023 Q2) we could see that the increased coal production has covered some of the loss in production from Wind and Hydro (all else being equal).
Production from coal-fired power stations in June 2024 (to 26th June)
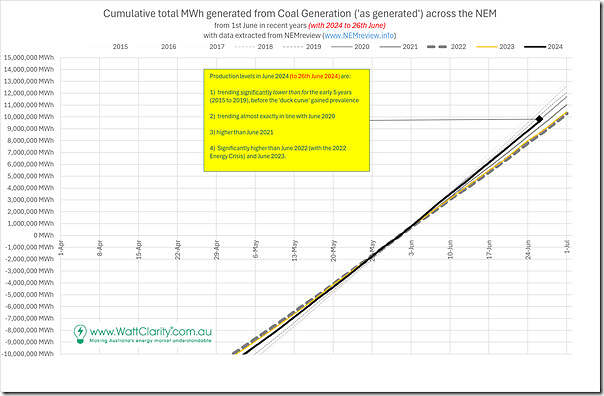
If we look (above) at the changing gradient of the line for 2024 Q2 we see some similarities to the two-speed nature of Gas in 2024 Q2, which prompts me to do the same thing as for gas below, in re-setting the zero axis to be 0MWh at the start of June and just summing from that point:
In this case, from the start of the month we see the rate of production in June 2024 is roughly the same as in June 2020, which is the highest of the past 5 years (i.e. 2020 to 2024).


Leave a comment