Note that the term “curtailability” is used in this article, whereas we could just have easily used the terms “demand response” or “demand side response” or “load shifting”, as they all mean much the same thing. All these terms have to do with the reduction of demand at certain, specific times, in response to some external trigger (generally market prices).
The term “demand side management”, on the other hand, incorporates “curtailability” but also includes the concept of an overall reduction in the level of energy consumed (e.g. consistently across the day) – resultant from the implementation of energy efficiency measures.
.
0) Why this article?
We have written this article as we have found ourselves being asked by a number of large industrial energy users about the potential benefits they stand to gain from curtailability.
Not being a consultant ourselves, we thought this article would prove a more efficient means (for both parties) of answering at least the basic questions.
1) Background to the NEM
A. In the Wholesale Market
The wholesale NEM is what’s termed as a gross-pool, energy-only market.
What this means is that:
1) All energy produced by generators in the NEM (those above a certain minimum size) must be dispatched by NEMMCO/AEMO through the NEM. Hence, all trading in the spot market is physical trading whereas all hedging in the market is only financial (i.e. not linked to physical delivery of MWh).
2) Generators are only paid for the energy they produce. There are essentially no capacity payments (i.e. other inducements to generators to make their capacity available to the market). What this means is that:
(a) Generators will generally only run when the spot price (at that time) exceeds the generators short-run marginal cost (SRMC) of operation (generally consumed fuel and variable O&M costs).
(b) Generators must seek also to run when the spot price is greatly in excess of their SRMC in order that they can recover on their long-run marginal cost, and make a return on their equity investment.
The end-result of this is that the market is very volatile.
It is important to note that this is an intended, and necessary, outcome of the design of the market chosen for the NEM. We noted this on the blog at the end of a volatile spell in summer 2007-08.
The key point that needs to be understood is that (because of the above):
1) At most times, the spot price for electricity is actually below what the true cost is of supplying this power (i.e. the Long-Run Marginal Cost)
2) For a low number of hours each year, the price spikes very, very high (up to the current market price cap of $10,000/MWh – which can be a 200x increase in price in a 5-minute period). Exactly when these price spikes occur can’t be reliably predicted in advance – however the fact that they will occur is well known and understood.
With this in mind, we’ll step into the retail market…
B. In the Retail Market
For more than 99.9% of energy users, the volatility in the wholesale market is nothing they should be concerned about, or are interested in. These energy users purchase electricity from any of a range of different electricity retailers (such as those identified in the Power Trading Schematic).
As with any commodity market, these retailers are “middlemen” between the wholesale and retail markets, acting as customers in the wholesale market (hence buying in a very volatile wholesale market where the price changes every 1/2 hour) and selling to you in the retail market (generally through fixed prices that might have some kind of peak, shoulder and off-peak components).
As such, there is a mismatch of risk – between the risk the retailer accepts in the wholesale market, and what they pass on to you in the retail market.
Whilst the retailer will hedge some of their risk in the wholesale market, it is not possible for them to hedge it all:
For instance, as an energy user, you do not give a firm commitment to take a precise amount of demand (and no more) at any given point in the day – and yet the retailer must hedge a firm amount in the wholesale market.
Hence, they absorb the “volume risk” you represent.
In order that they have a sustainable business, the retailer then charges you a risk premium to take this into account. The less certain they are of your load, the higher the premium.
(this is only one example of risk to the retailer)
The end-story is that the retail contract you are offered contains a bundle of premiums that are added on top of what the retailer sees your load would cost to supply** if purchasing power straight from the spot market. In other words, there is a premium you pay for this certainty of pricing, and flexibility of consumption.
When the retailer determines what your load “would cost to supply” they might use a couple different methods, including the following:
1) They would look to the financial markets to see what a close approximation to your load shape could be hedged for with derivatives.
2) They will also do their own forecasting of the spot market, looking forward, to draw their own conclusions of possible scenarios for pool price paths.
C. Bridging Wholesale and Retail
The methods each retailer uses will vary, somewhat (which is one of the reasons why the prices they offer you will vary). The underlying message is that the contract you are offered will take into account such issues as the uncertainty of your load shape, and expected volatility in spot prices.
For some energy users, this represents a significant opportunity…
For energy users who are willing to accept the risk related to spot price volatility, and the uncertainty of their own consumption patterns, it is possible that they can make considerable savings on the total cost of electricity consumed across a year.
Curtailability, and some aspect of spot price exposure, are integral parts of this new approach.
It’s not for everyone – but for those who can adopt this approach, they can stand to gain considerably.
2) Who is this relevant to?
It is true that all electricity users, no matter how large (or small) could stand to gain some benefit from the use of curtailability in the NEM. Correspondingly, many aspects of the electricity supply industry stand to gain considerable benefit from the the encouragement of greater levels of demand response in the NEM (for a more general discussion of the benefits of curtailability, see this recent article from the Economist).
This article is written specifically with respect to large industrial energy users – which we would notionally define as those:
1) who consume in excess of 20,000MWh annually of electricity (or perhaps many multiples as large); and
2) who consume this electricity from a small number of (or even a single) industrial site; so
3) who spend in excess of Aud $1,000,000 p.a. for the energy component of their electricity bills each year (i.e. not including transmission, distribution and green charges). This will represent a significant, though perhaps not dominant, percentage of their overall operating cost each year.
4) furthermore, these energy users will have a high degree of technical expertise with respect to the “widgets” they produce, though perhaps not necessarily the electricity market.
It is plausible that the principles outlined in this article could lead such energy users to make savings of the order of 20% of their total spend on the energy component of their electricity bills each year.
However, it is important to note that the exact benefits will be specific to an individual energy user or to a particular site, and will depend on a year-to-year basis on what’s happening in the NEM.
Should such potential savings be of interest to you, we urge you to give this further detailed consideration, specific to your own situation, and with the assistance of one of a handful of consultants who work in this area in Australia. We’re not consultants, but can suggest a couple you can choose from, if you so desire.
3) General Thoughts about Volatility
In the period since we have started providing commentary about the market on WattClarity ®, we have made numerous posts referencing the issue of spot price volatility in the wholesale part of the NEM. With respect to these posts:
1) Many of these articles contain snapshots from our NEM-Watch product that provide a graphical representation of how volatile the price can be (jumping from a “normal” level of about $50/MWh to the price cap of $10,000/MWh in only a 5-minute dispatch interval.
2) The latest version of NEM-Watch (v8) now makes it easier for you to understand the implications of transmission constraints in the volatility delivered in the market – with the live display of “Economic Islands”we first discussed in early 2008.
3) You will note in these posts that the volatility tends to occur at times of peak demand – i.e. in peak summer and winter demand periods. However, that does not mean that they don’t occur at all during other times.
One way to understand the impact of the price volatility is to look at the price distribution chart for a given region.
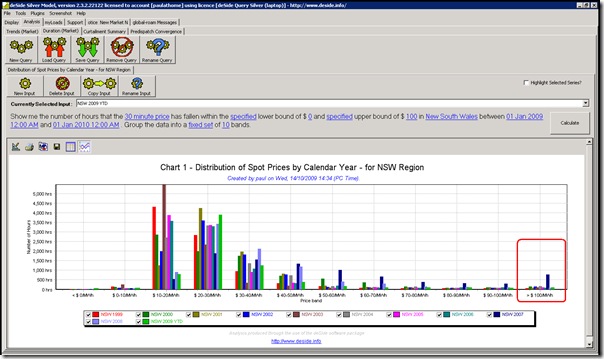
The following distribution chart has been developed through the deSide software to show a count of the number of hours in which the NSW price fell within certain bounds over the course of a given calendar year.
1) All calendar years have been analysed, from 1999 (the first full-year of NEM operation)
2) The 2009 calendar year was assessed on the basis of the year-to-date results as at 14th October 2009. Hence the bars for 2009 will be consistently lower (because of fewer time periods) and may show less volatility than the full year would (as we’re missing November and December – which is when some volatility is expected)
Note that we’ve chosen to look at NSW in this article for no real reason other than the fact that NSW is the largest region, and hence (perhaps) this article will be more directly relevant to a greater number of readers. The main findings will be similar for the other regions as well (though there are nuances you need to be aware of).
There’s a number of things you can deduce from this chart, with some of the most important being as follows:
1) There is a degree of variability apparent in the shape of prices for each of the 11 calendar-years shown here. However, there are some common threads that underlie the shape apparent for all of the years.
2) The vast majority of prices have consistently fallen below $50/MWh and that prices have risen above $100/MWh relatively rarely each year.
3) The 2007 calendar year shows a significantly different price shape than in the other 10 years. This was due to the effect of the NEM-wide drought, which we previously discussed.
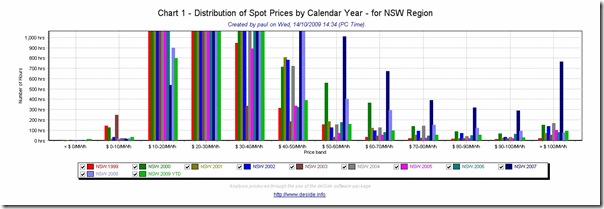
In the following chart, we have “zoomed in” to allow you to see the upper-end of the chart.
Hence, the following additional points can be made:
4) In each of the years (other than 2007), there were less than 200 hours (in each year) when the price exceeded $100/MWh
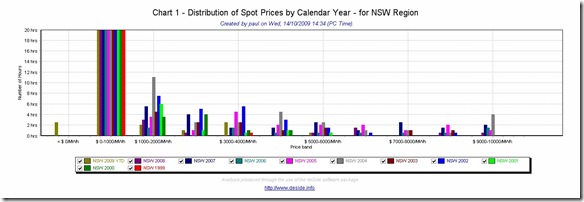
5) Further analysis (in which we increased the price ranges under consideration, as shown in the chart below) reveals that there is no significant difference in the distribution of prices for 2007 above $1000/MWh – or, in other words, there were perhaps 600-700 hours in which prices fell in the range $100/MWh – $1,000/MWh because of the drought.
6) Hence, we can see that in each of the 11 years of NEM history, the market has delivered less than 200 hours of prices above $1000/MWh.
(a) Obviously the usual disclaimers apply here (past performance is no guarantee of the future, etc)
(b) In the absence of any reason as to why there might be changes**, it is reasonable to begin to think that future years might behave something like the pattern seen across past years.
(c) **Reasons why there might be changes in the pattern of pricing could be many and varied. A starting list would include the following:
i. prolonged drought (we did see some changes in 2007, but not to the extent that it impacted on the nature of prices > $1000/MWh)
ii. carbon pricing, in some form (if/when it is introduced)
iii. technological change
iv. major changes to market rules,
v. major changes to market structure7) Where prices did rise above $1,000/MWh, there was a fairly even spread in terms of which $1000 “bracket” they landed in. This varied somewhat each year.
Finally, it is important to note the impact of this volatility – a single 1/2-hour trading interval at VOLL adds approximately $0.57/MWh to the annual time-weighted average price of electricity over an entire year.
1) Hence, 200 hours of VOLL (were it to be experienced) would have the effect of adding $228/MWh to the annual average price.
2) Of course, there was not 200 hours experienced at VOLL in any given year. The most, as can be seen above, was only 4 hours – but this would have added $4/MWh to the annual average cost of energy.
Hence, simply avoiding the purchase of energy during those high-priced periods would have the effect of significantly reducing your energy bill. As noted above, the normal retail contract you are offered has these kinds of costs “averaged-in” to the price you are offered. Hence, you need to do two things to take full advantage of these benefits:
1) Adopt an energy purchasing arrangement with some component of spot price exposure (there are several ways you can do this).
2) Stop consuming for the 1/2-hours when the price is high!
This article has been written to provide further details.
4) Specific Example of the Benefits (with a hypothetical load in NSW)
To see the benefits of curtailability more clearly, we need to utilise another piece of functionality built into the deSide application.
We have defined a hypothetical industrial load with a 2MW peak and 1MW off-peak load shape (though it should be noted that deSide can facilitate your conduct of the same analysis, but with reference to your own actual historical half-hourly load trace). Again, we have written this article assuming the load is in NSW (but the same logic elsewhere as it does to this region).
We have then stepped through each calendar year in turn and performed analysis of the benefits of curtailability. The results are shown below, in reverse-chronological order.
Benefits in 2009 Year-to-Date
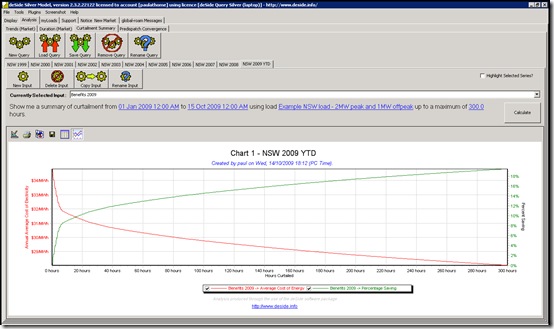
The following chart was calculated as follows:
For the load referenced (in this case hypothetical) a profile was drawn up of the half-hour electricity purchase cost across all 17,520 half-hours in the year. Then, starting at the most expensive half-hour, these purchase costs are progressively removed, on the assumption that you had voluntarily curtailed your demand at these points in time.
Hence, the chart shows (for increasing number of total hours curtailed across the x-axis) what the total benefit would have been, in terms of reduced annual volume-weighted average cost of electricity purchased, and percentage saved of total energy costs across the year.
This chart (click on the chart for a better view) was generated on 14th October 2009 – so before what (we presume) will be a hot summer period, with added volatility. Hence, it is reasonable to assume that the benefits shown above understate what they would actually be for the full calendar year.
Notwithstanding the fact that this analysis is not for a complete year, a very clear “law of diminishing returns” is shown for only a small number of hours. You can read from this chart that:
1) With only 20 hours curtailment over the year (to date), you would have saved about 10% of the total cost of electricity consumed across the year;
2) As such, your volume-weighted average cost of energy would have reduced from $34.82/MWh to $31.23/MWh.
As you will see below (and which should be intuitive from the distribution charts shown above) the nature of the benefit tends to be fairly similar from one year to the next (as the shape of prices has not changed) – it’s just the quantum of the benefit that is variable.
Benefits in 2008
Similar analysis was performed for calendar 2008, revealing this benefit:
Hence, for 2008 we can see that:
1) With only 20 hours curtailment over the year, you would have saved about 13% of the total cost of electricity consumed across the year;
2) As such, your volume-weighted average cost of energy would have reduced from $42.16/MWh to $36.54/MWh.
Hence the benefit would have been higher in 2008, with the average price being higher.
Benefits in 2007
Again, the benefit curve for 2007 looks similar (even with the impact of the drought shown):
For this year:
1) With only 20 hours curtailment over the year, you would have saved about 18% of the total cost of electricity consumed across the year;
2) As such, your volume-weighted average cost of energy would have reduced from $73.48/MWh to $60.12/MWh.
Hence, despite the drought shifting prices higher across the board, there were significant benefits to be gained.
Benefits in 2006
The curve for 2006 looks similar:
The following benefits can be seen:
1) With only 20 hours curtailment over the year, you would have saved about 17.6% of the total cost of electricity consumed across the year;
2) As such, your volume-weighted average cost of energy would have reduced from $33.55/MWh to $27.65/MWh.
Hence, still a significant benefit in 2006 – even though prices were lower across the board.
Benefits in 2005
The benefit curve for 2005 shows the same pattern:
In numerical terms:
1) With only 20 hours curtailment over the year, you would have saved a massive 32% of the total cost of electricity consumed across the year;
2) As such, your volume-weighted average cost of energy would have reduced from $39.45/MWh to $26.92/MWh.
Would have been a great year for your bottom line!
Benefits in 2004
Again, the same pattern in 2004:
The numbers show what would have been another great year:
1) With only 20 hours curtailment over the year, you would have saved a whopping 29% of the total cost of electricity consumed across the year;
2) As such, your volume-weighted average cost of energy would have reduced from $39.92/MWh to $35.25/MWh.
Benefits in 2003
2003 shows a similar curve as all the other years:
Benefits somewhat lower in 2003, but still nothing to be sneezed at:
1) With only 20 hours curtailment over the year, you would have saved 25% of the total cost of electricity consumed across the year;
2) As such, your volume-weighted average cost of energy would have reduced from $28.60/MWh to $21.31/MWh.
Benefits in 2002
A similar benefit curve shown for 2002:
In numerical terms:
1) With only 20 hours curtailment over the year, you would have saved about 21% of the total cost of electricity consumed across the year;
2) As such, your volume-weighted average cost of energy would have reduced from $43.36/MWh to $34.17/MWh.
Benefits in 2001
In 2001 the following curve was revealed:
The numbers reveal a similar pattern, albeit with numbers lower than the several years following:
1) With only 20 hours curtailment over the year, you would have saved about 10% of the total cost of electricity consumed across the year;
2) As such, your volume-weighted average cost of energy would have reduced from $35.21/MWh to $31.61/MWh.
Benefits in 2000
A similar pattern is shown for 2000:
As was the case for 2001, we see a benefit lower than in later years:
1) With only 20 hours curtailment over the year, you would have saved about 10% of the total cost of electricity consumed across the year;
2) As such, your volume-weighted average cost of energy would have reduced from $37.32/MWh to $33.59/MWh.
Benefits in 1999
In 1999, the first full year of NEM operation, we see the following benefit curves:
As can be seen, the benefits in 1999 would have been the most muted of the 11 years of NEM history analysed:
1) With only 20 hours curtailment over the year, you would have saved only 2.4% of the total cost of electricity consumed across the year;
2) As such, your volume-weighted average cost of energy would have reduced from $23.51/MWh to $22.94/MWh.
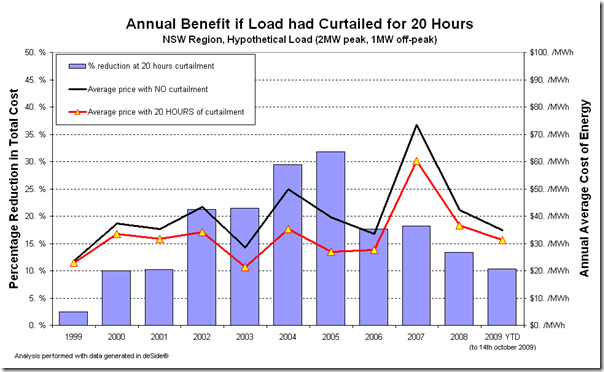
Hence, to summarise the potential benefit a hypothetical energy user might gain across each of the years as follows:
As can be seen, there has been a consistent benefit shown (across all 11 years) for a significant benefit based on only 20 hours of load curtailment. This is because the shape of prices has been consistent across all years.
The absolute level of the benefit has varied significantly, as has the absolute level of average prices. These two metrics have been based, moreso, on the specifics of what has happened in the market within a given year.
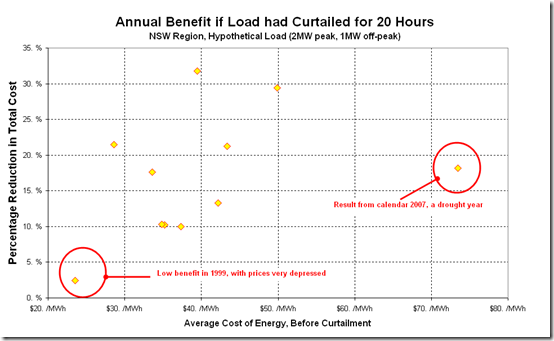
In particular we see a very low benefit in 1999 (when prices were very flat, and low, across the year). This is shown clearly in the following scatter chart:
As can be seen from this chart, there is a loose correlation between the starting level of prices in the market and the benefits that could be delivered. This is understandable, given the impact of volatility on average prices – but the result for 2007 is shown highlighted to indicate the impact of the drought.
In more recent years, we see a decline in the level of benefit available from one year to the next. To understand why this has occurred (and, importantly for you, whether the trend will continue into the future, would require further analysis.
5) Some pre-requisites to obtaining the benefits
I’m running out of time to complete this post, but the following are some comments about some pre-requisites which would need to be addressed to take advantage of these potential savings.
A contract with spot price exposure
It should be self-evident from the above that you would require some degree of spot price exposure in your energy purchasing arrangements.
Most of the clients we serve choose to do this through a retailer, whilst one purchases power direct from the AEMO. We have heard (anecdotally) that some retailers are more prepared to offer this type of service than others – so it would pay for you to shop around.
Ability (and willingness) to curtail when the price is high
In our experience, this is easier to achieve the benefits when your industrial facilities incorporate large “lumps” of load that can be easily switched off, without causing no damage to plant or product.
1) Hence electric arc furnaces, electrolysis cells and large pumps and motors are well suited (in some cases).
2) The flip side is that back-up generation onsite could be used (if configured to allow this) as an alternative, hence reducing consumption from the grid – or, indeed, exporting at times of high spot prices.
Coupled with the technical requirements onsite, there also needs to be a willingness (by management, operations and maintenance people) to accept this new paradigm for operations.
Risk Management Processes and Procedures
In the traditional paradigm, the price and volume risk is generally hidden from the view of your purchasing manager in the bundled product you are offered by your retailer.
Accommodating this new approach means bringing these risks into full view, and managing them effectively (possibly by a combination of physical and financial means).
For those energy users seriously interested in this possibility, more detailed, specific analysis is required. You could either do this in-house, or with the assistance of an external consultant. We are not consultants (just software developers) but can point you in the direction of a couple of credible consultants, if you would like to ask…




Leave a comment