

Yesterday evening we briefly noted ‘Spot price volatility in South Australia on Tuesday evening 6th January 2026’.
… that article contained a NEMwatch snapshot that was good at summing up some highlights … e.g.
(a) strong but constrained imports from VIC (remembering PEC stage 1 still effectively comes from VIC inside of NEMDE),
(b) solar gone to bed,
(c) moderate level of ‘Market Demand’, etc…
This morning we don’t have much ‘spare’ time, but I quickly extracted the following images from the ‘Bids & Offers’ widget in ez2view in order to take a quick initial look
Summary across all fuel types
We’ll start with this aggregate view:
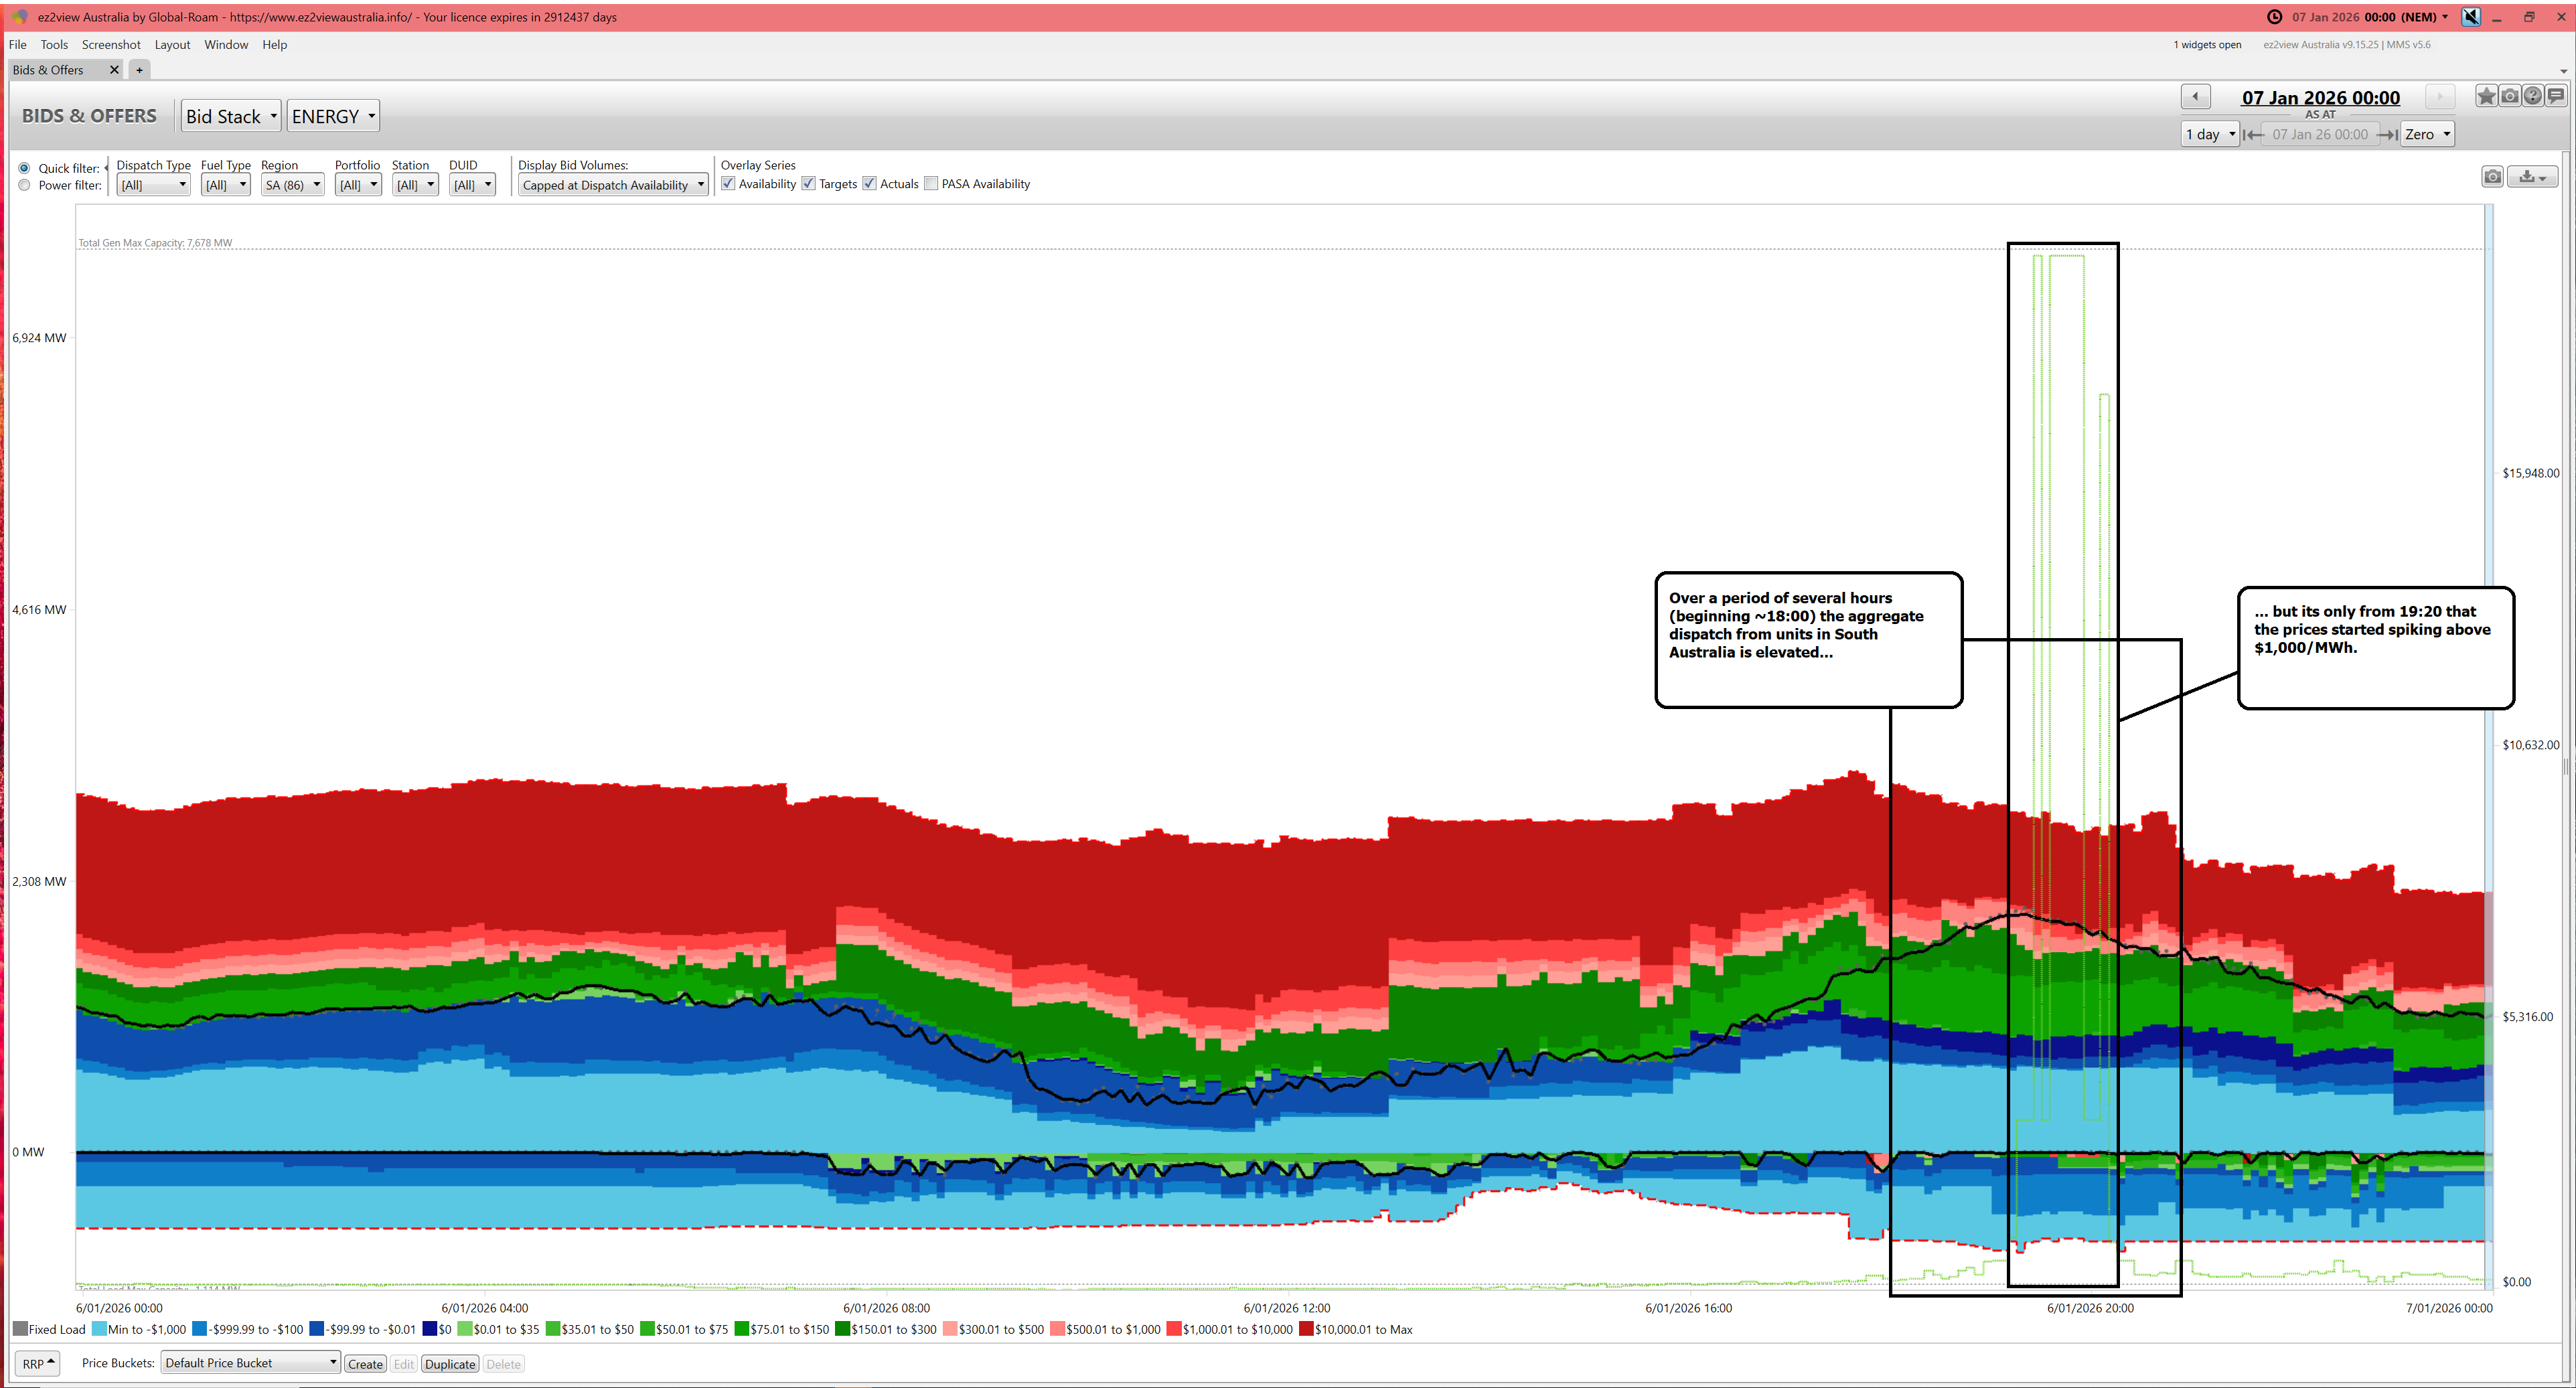
Note that there were several hours where aggregate output across all SA units was elevated … but it was only from 19:20 that prices spiked above $1,000/MWh.
By Fuel Type
Let’s now break apart the trended bid stack above into its component parts…
First, looking at VRE
Given we’re moving into the ‘VRE + Firming’ paradigm of this energy transition (especially with South Australia leading the charge) we’ll start with the VRE components.
Large Solar
Remembering that rooftop PV (and Consumer Energy Resources in broader terms) don’t actively bid into the market, we’ll look just at the ‘Large Solar’ aggregate:

As noted above, solar had mostly gone to bed at the time of the price volatility (and fully gone to bed at the end). That’s quite a contrast to the morning period when large volumes were bid at high prices to avoid running during negative priced periods.
Wind
Here’s the aggregate bidding from Wind Farms:
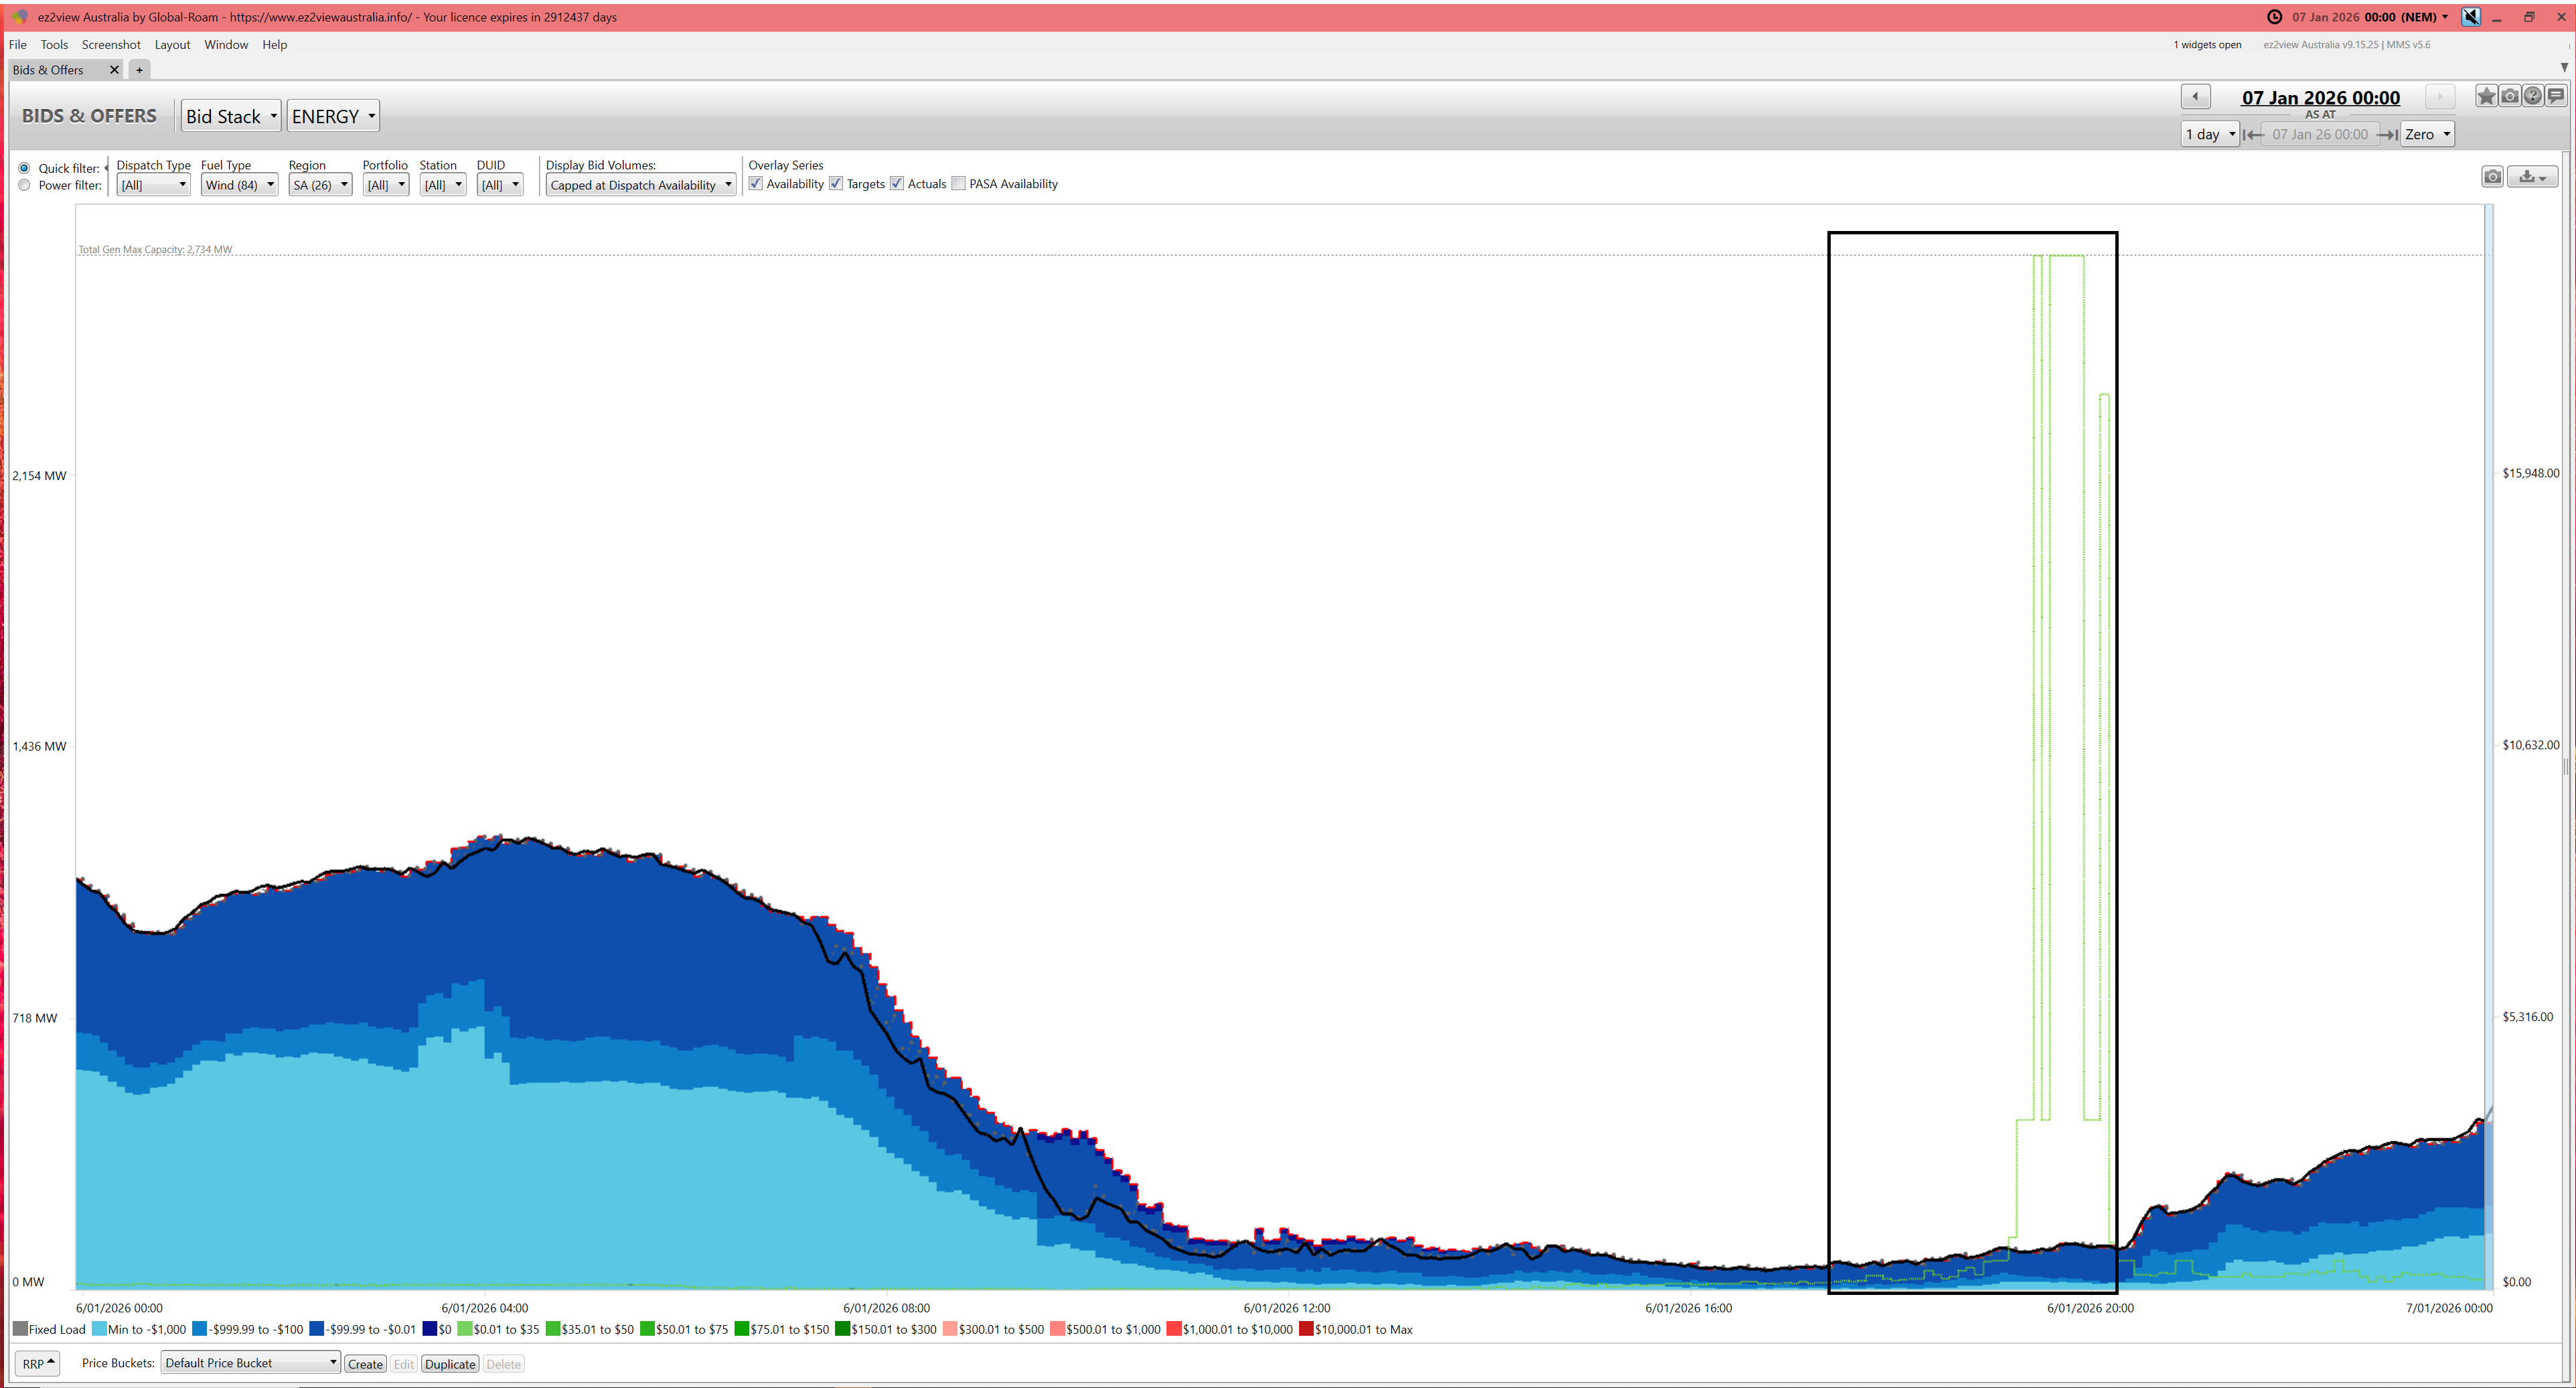
This was a low wind period through the day, but particularly during the evening.
Now, looking at Firming
We’ll look at firming, starting the new and ending with the old.
Negawatts
There are two Negawatt DUIDs registered (for ENERGY) in the South Australian region, for 7MW total capacity:
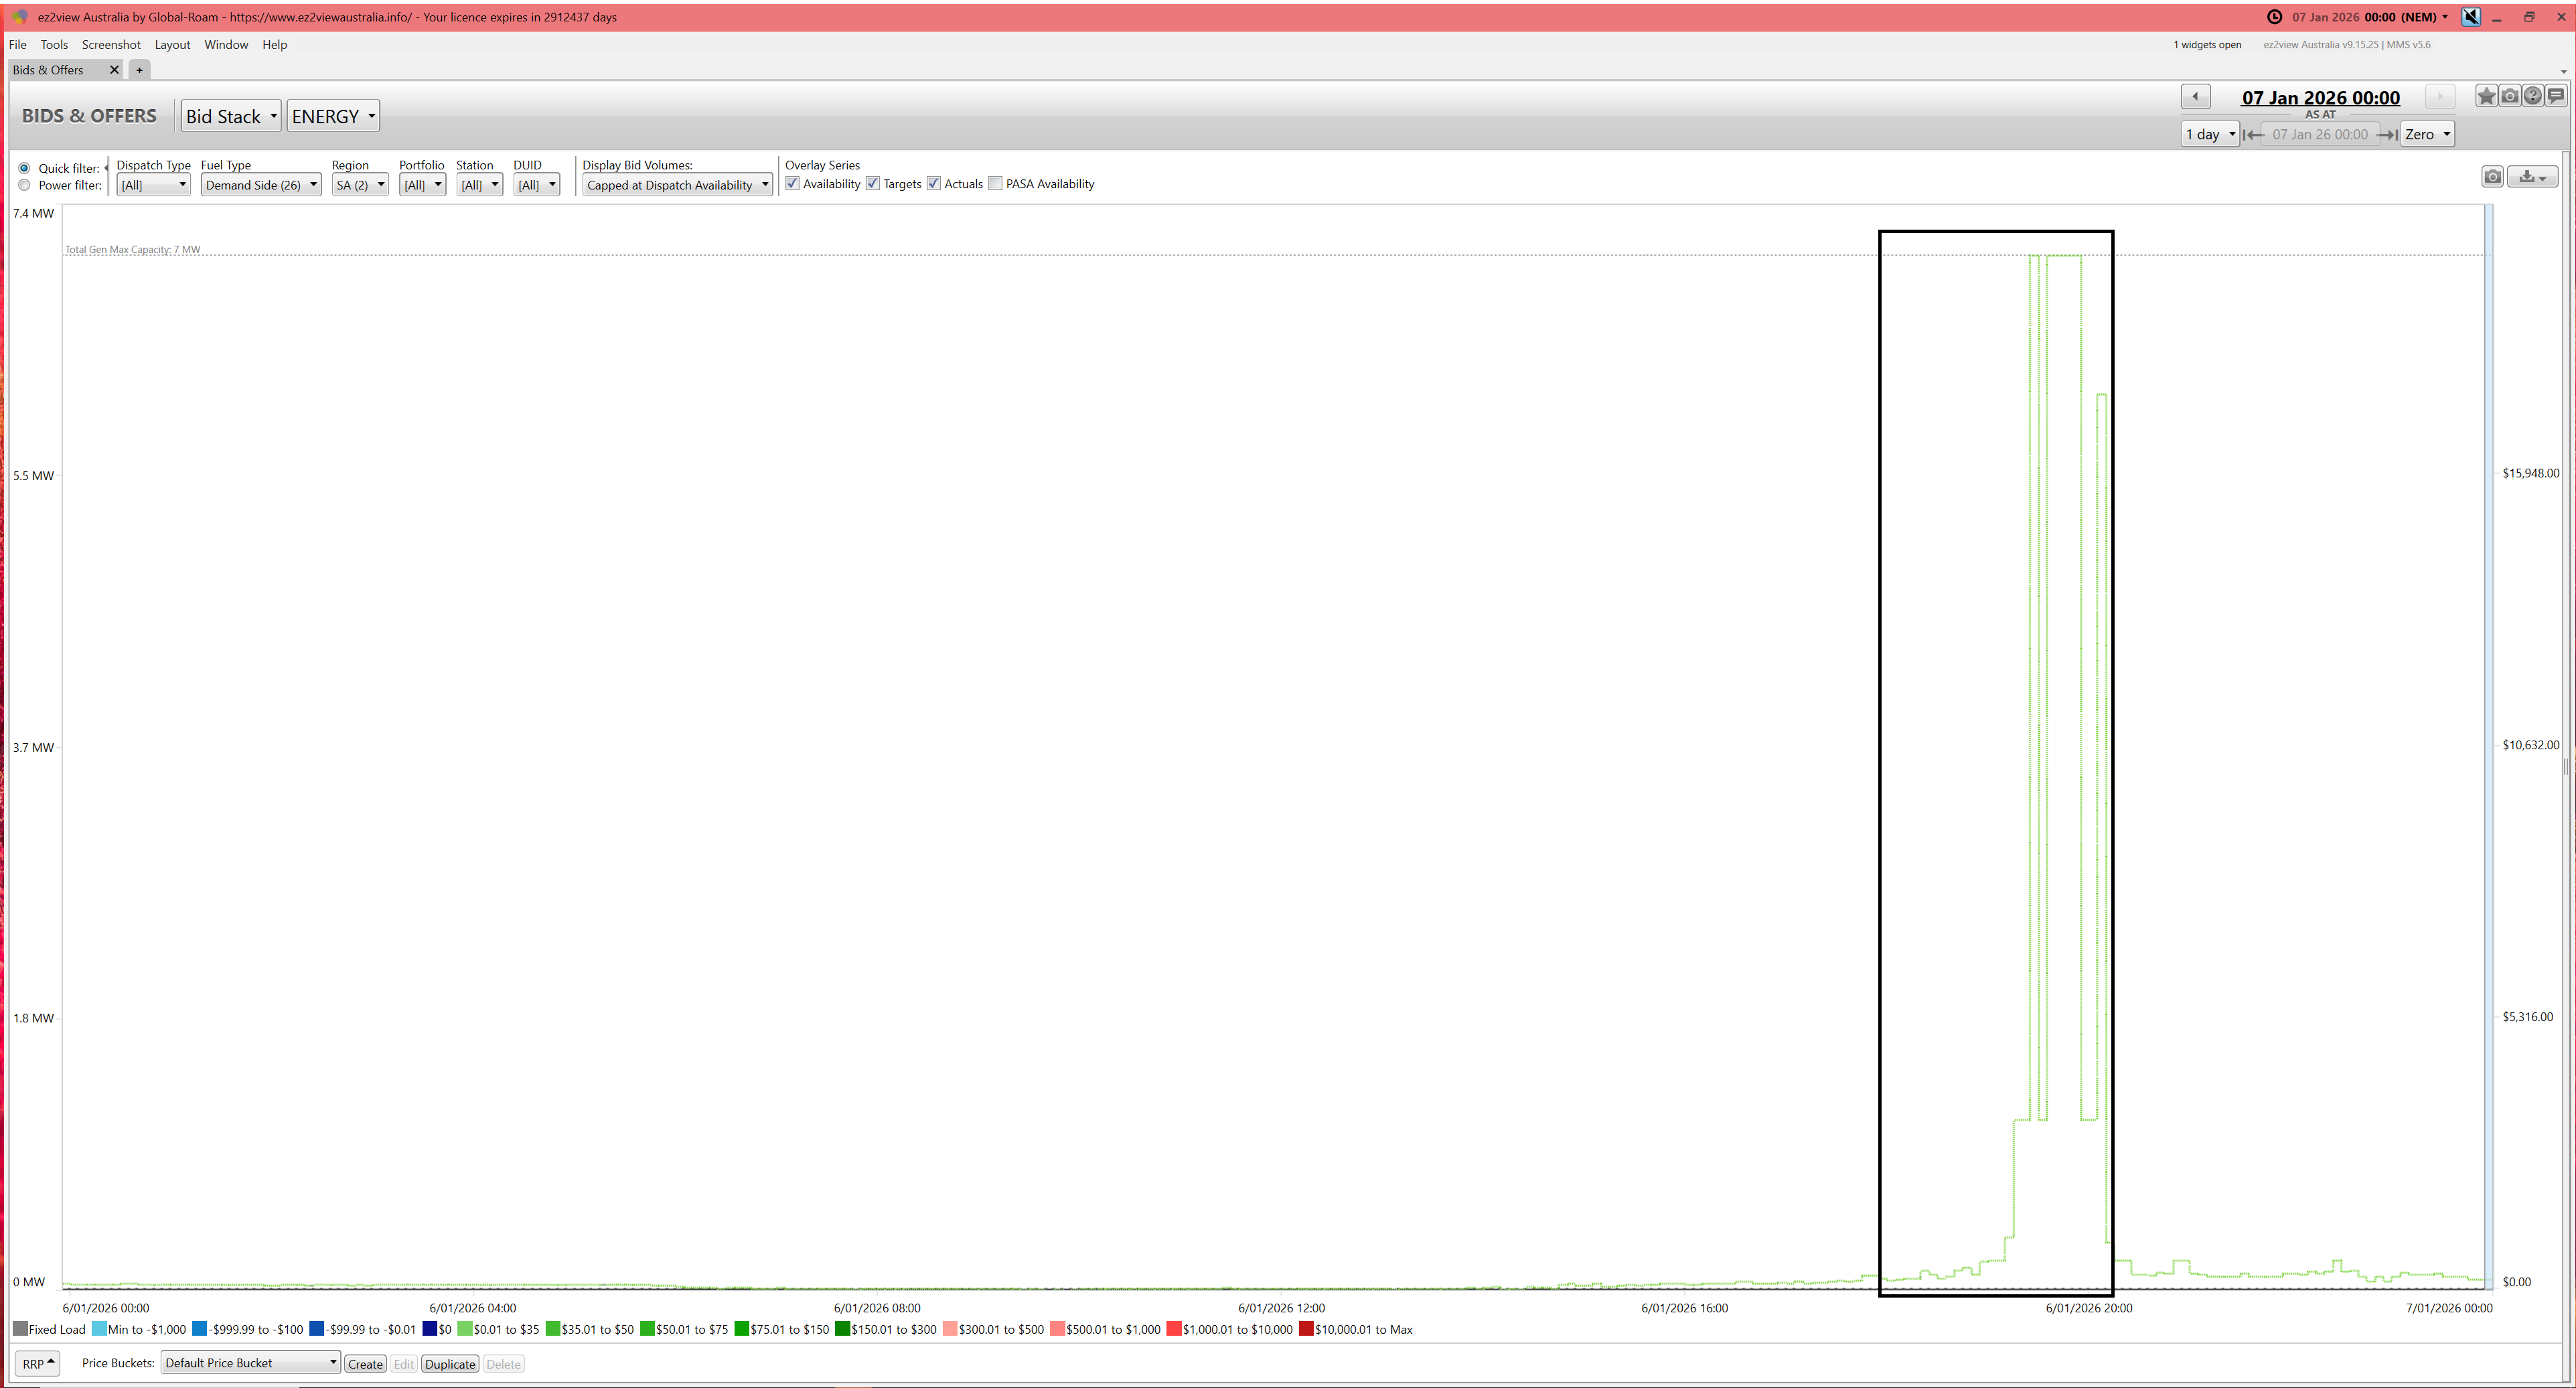
But even with the prices lasting almost an hour, they did not even bid, and so did not produce anything.
Batteries
A growing number of people are recognising the increasingly large contribution from batteries (especially in a region with a relatively small size like South Australia relative to the size of the battery capacity, which is now up at 1,140MW):
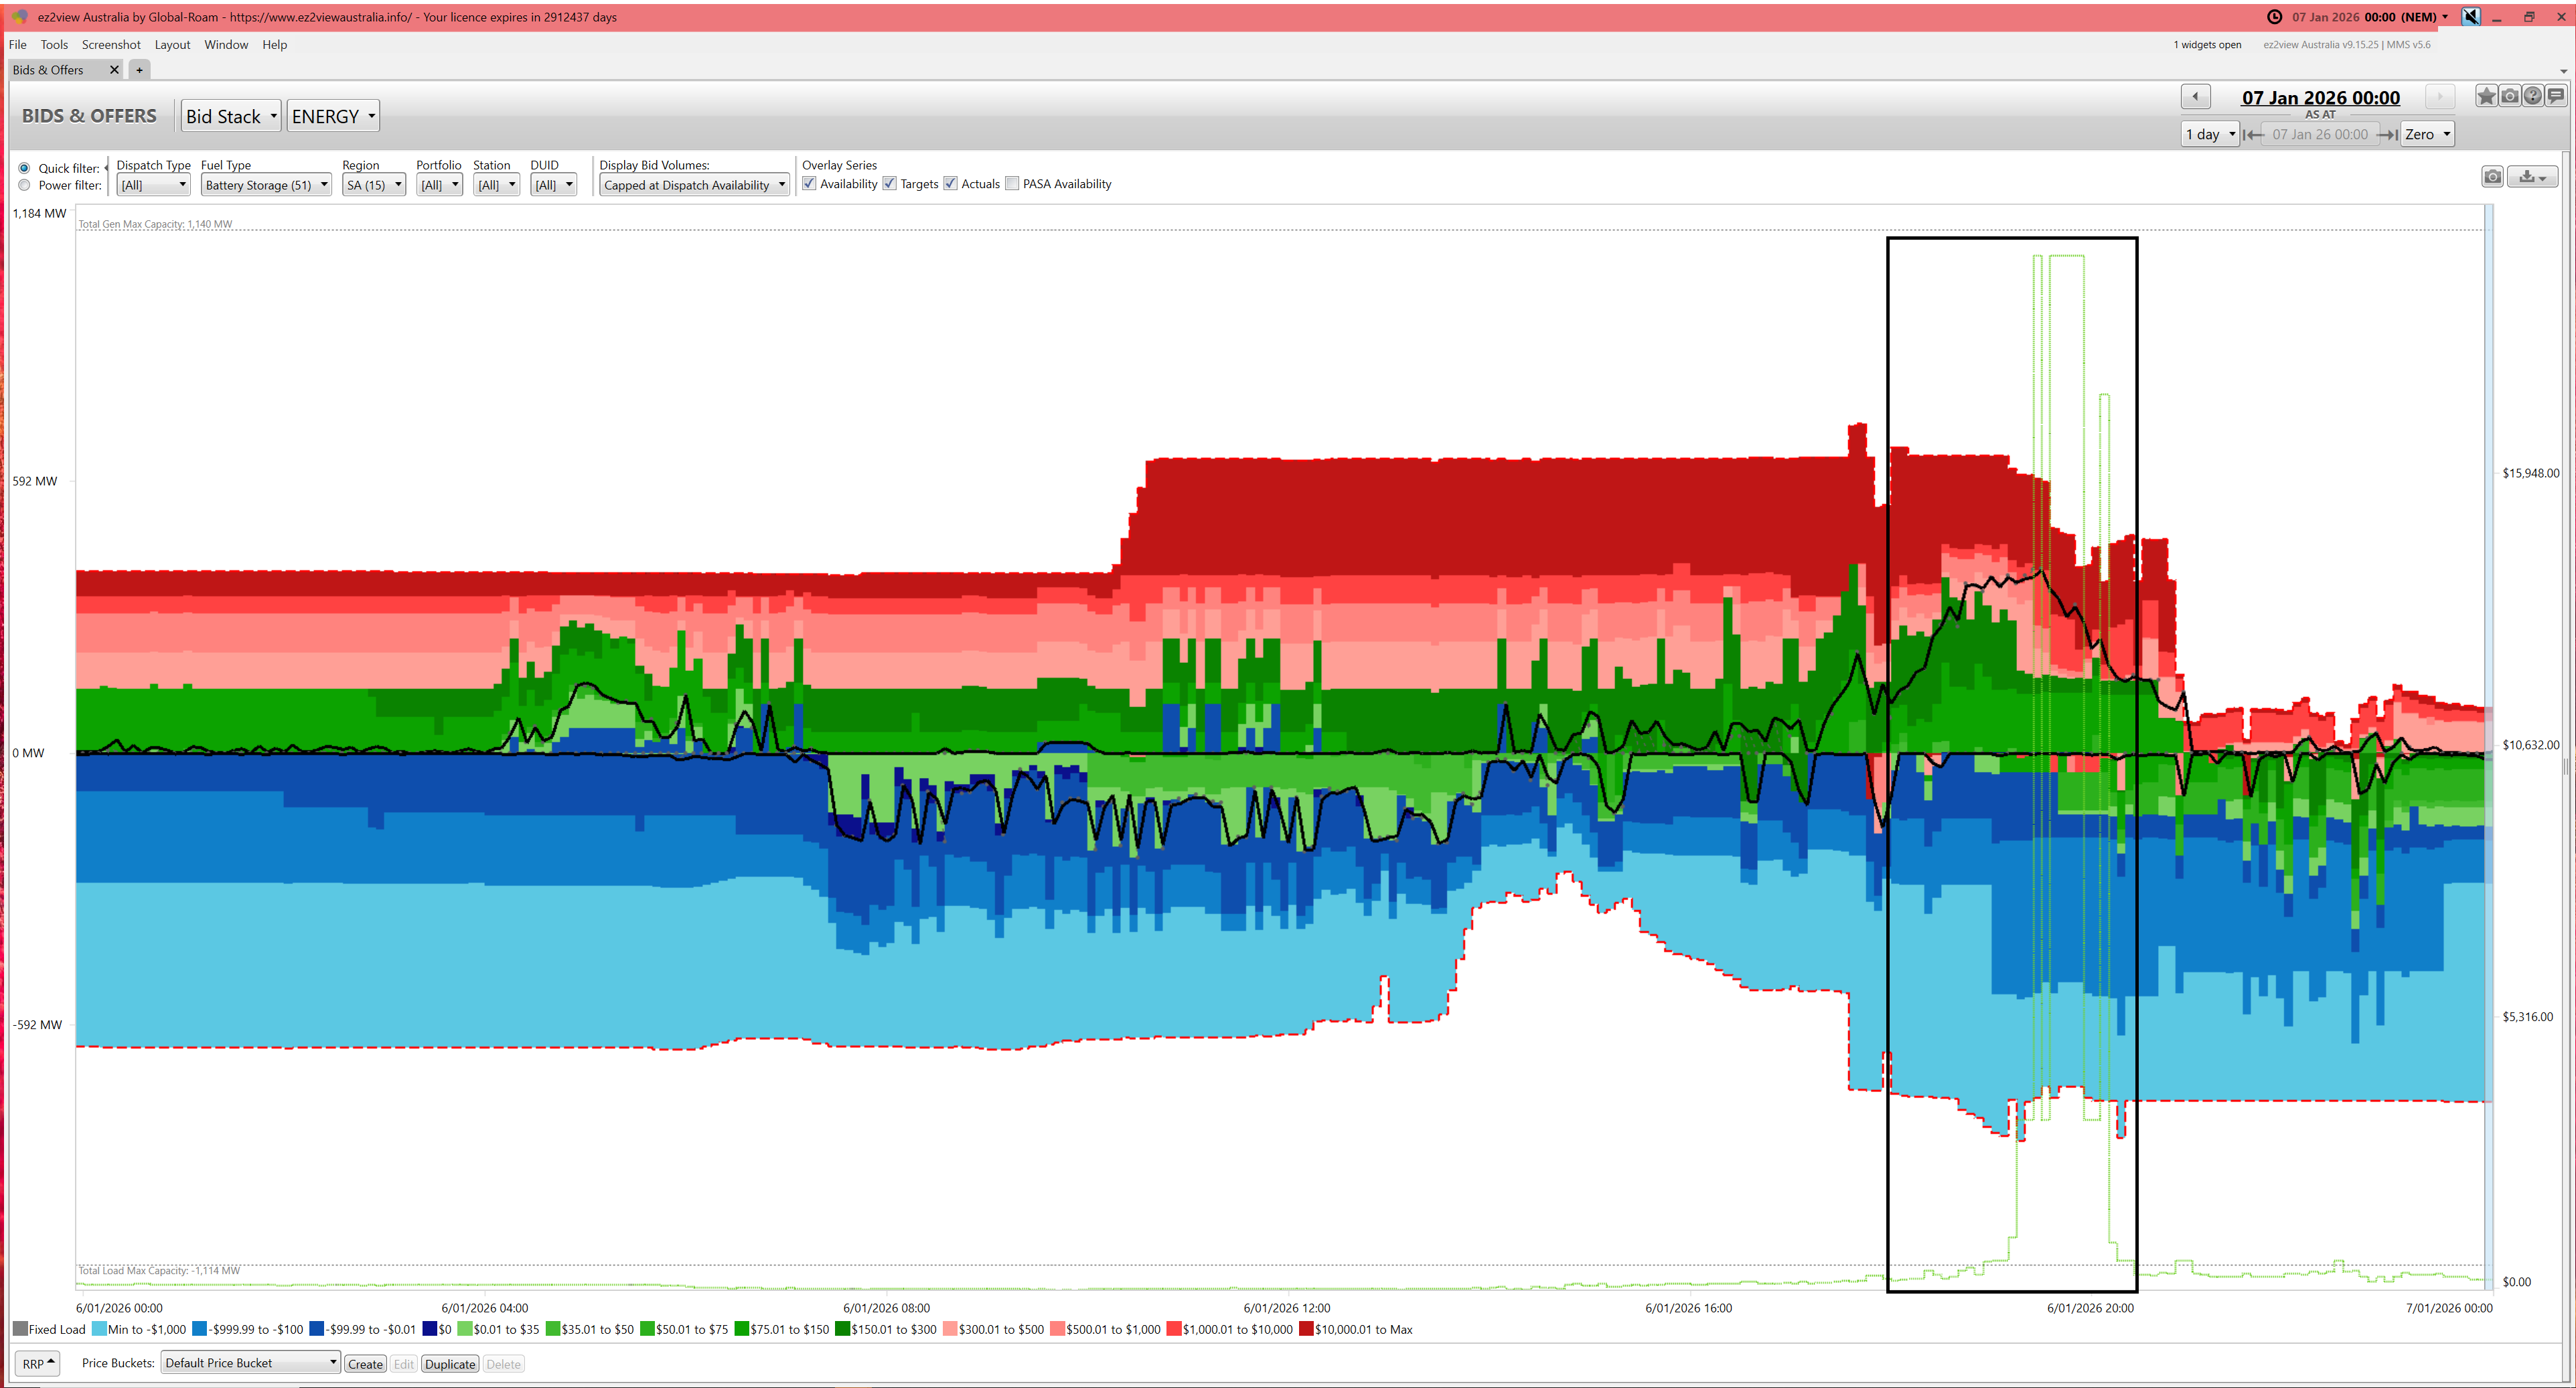
The operations of the batteries initially was effective in resisting the pricing pressure – but by 19:20 they were beginning to be depleted, ‘allowing’ prices to jump.
Gas
Here’s a view of the aggregate (bidding and) dispatch from the gas-fired units:
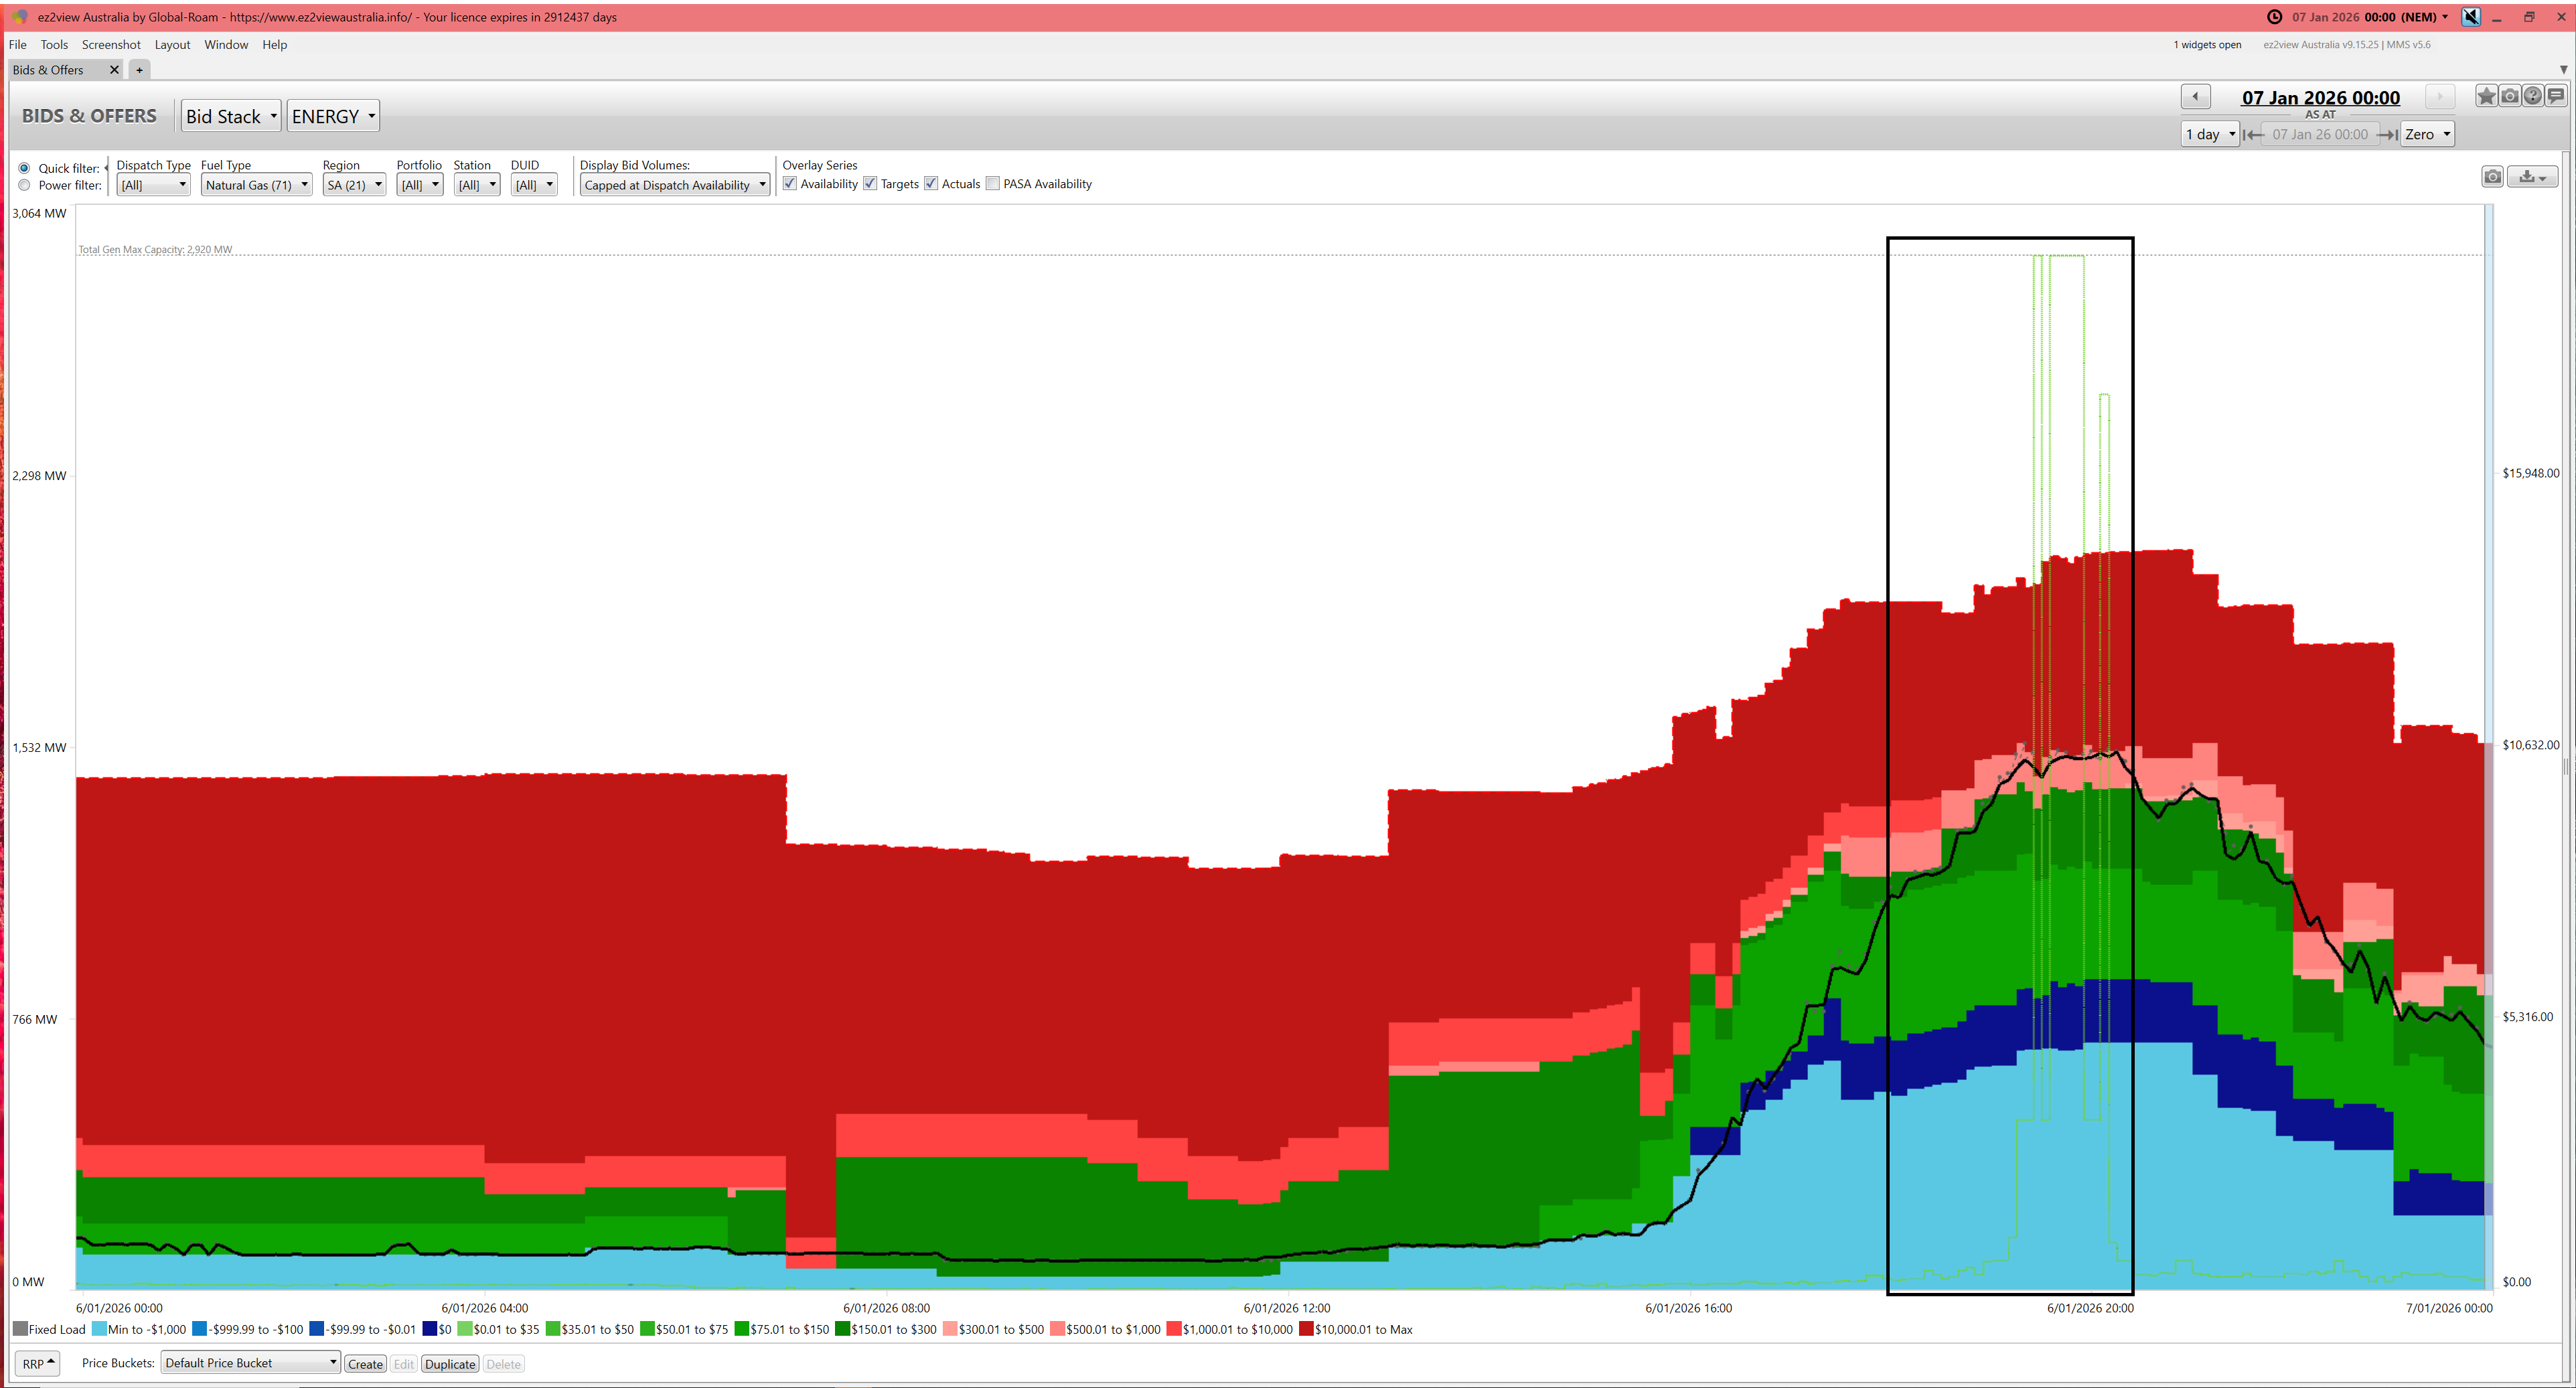
Understandably, these (are not so energy-limited and so) were able to hold on for longer.
Liquid
Curiously, the liquid-fuelled plant in South Australia did not get a run until after the volatility:
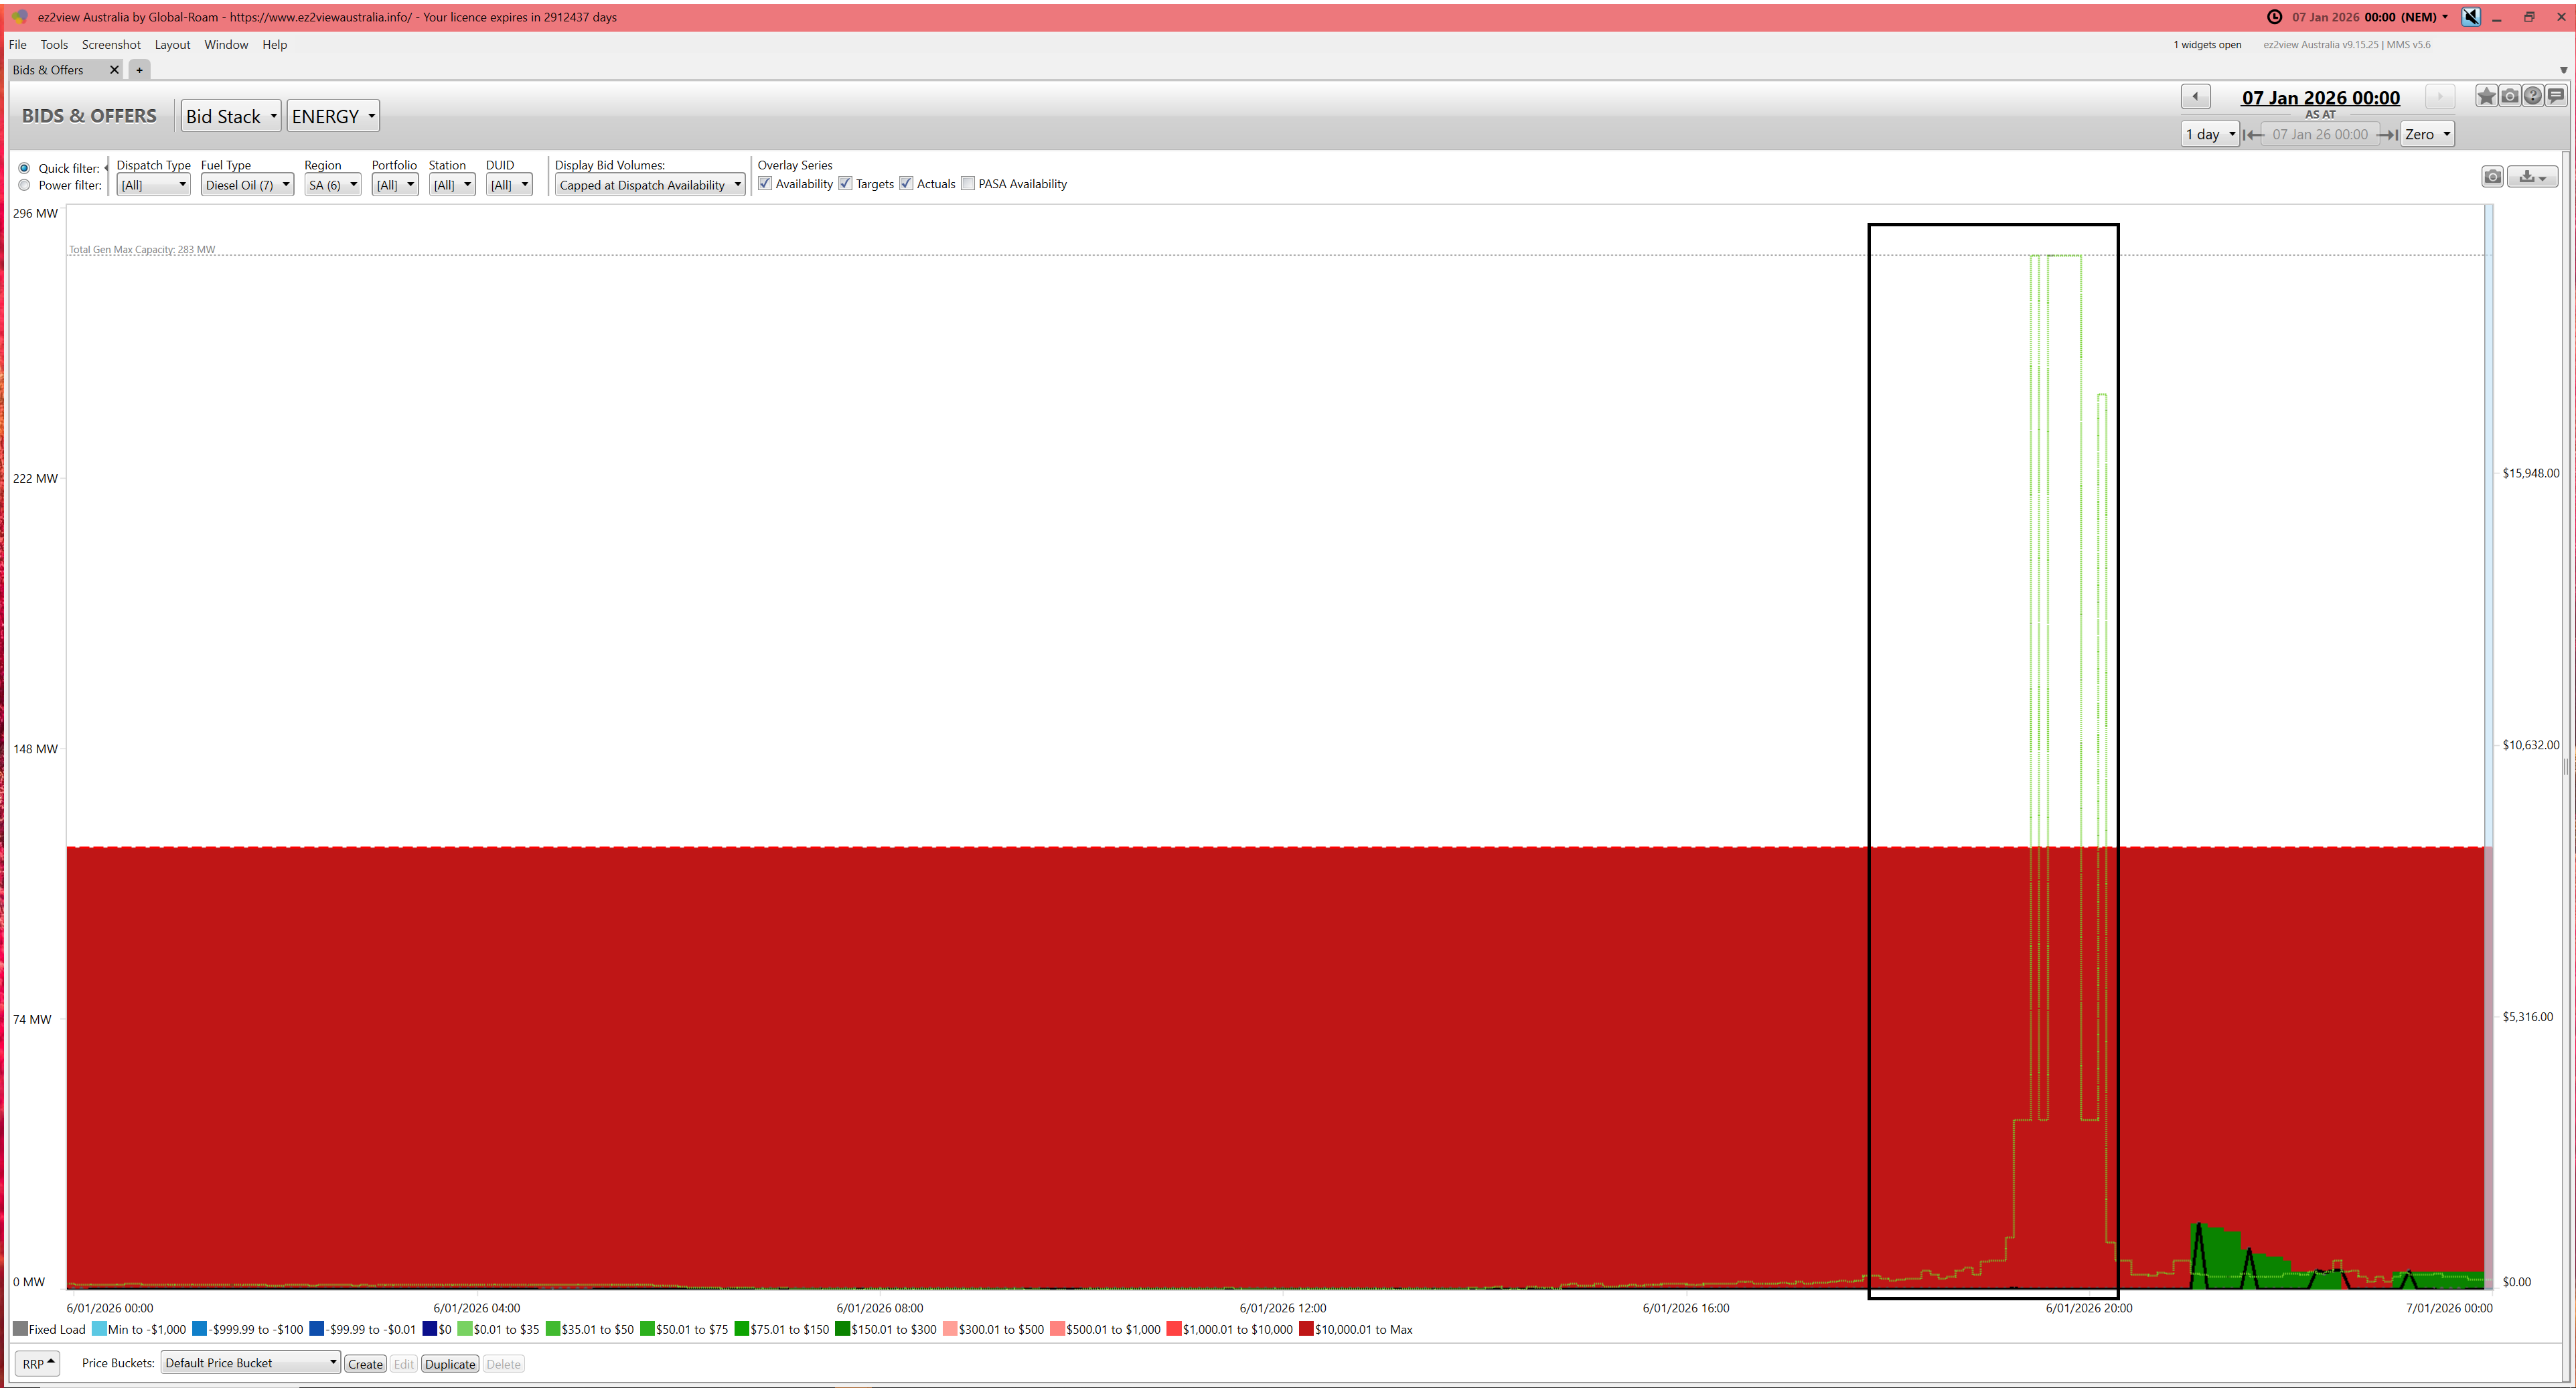
We’ve not had time to look further….

A classic example of one or more participants being able to exercise pricing power through the event. Have a look at which participant/s had online capacity at batteries or synchronised gas units – ie not fast-start GTs etc – offered at MPC!