
Following our initial observation of Wednesday’s price spike, and a subsequent deeper review of drivers, here we’ll share this quick look at mainland system frequency during this period.
In the chart below, we can see frequency runs from 09:00 to 14:00 in the top panel. Below, the zoomed-in panel separates 10:30 to 11:00 in orange, and 11:00 to 11:30 in green.
We can see the lowest point was measured at 10:51:01.7 by our Global-Roam frequency logger — we can see that frequency remained just within the NOFB (dashed line on chart) at 49.853 Hz.
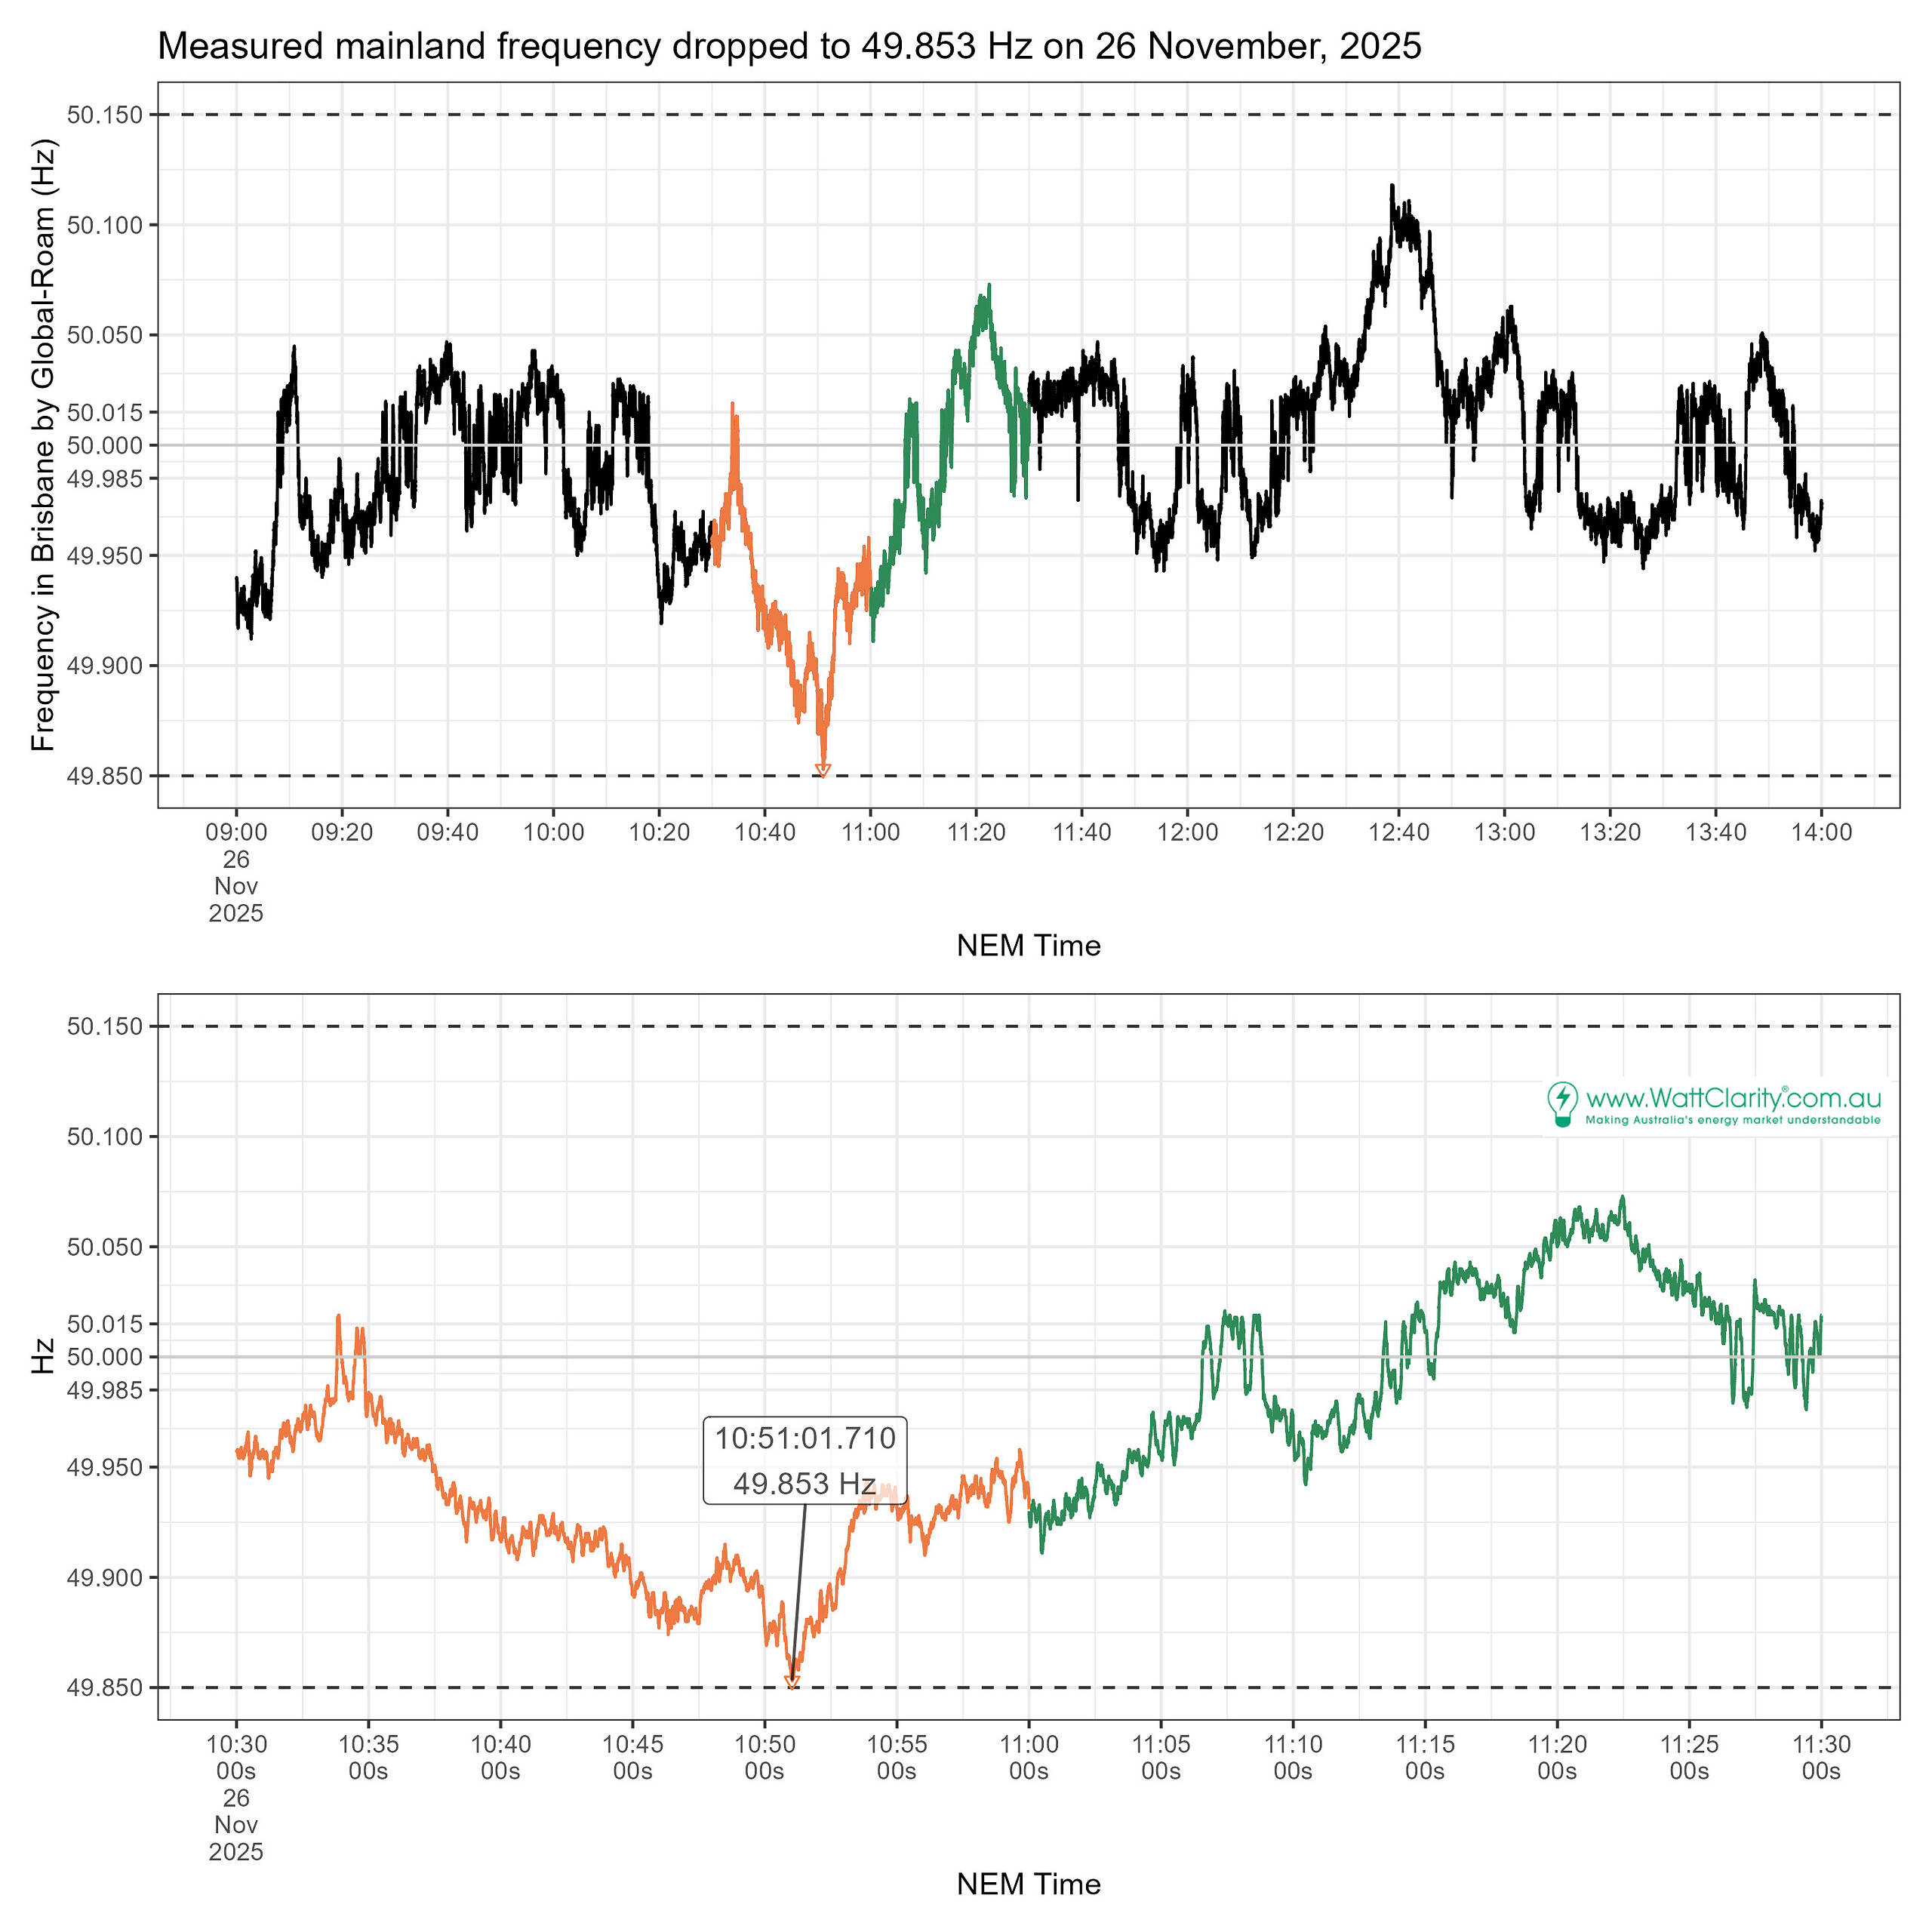
There was a later high-point just before 12:40 indicating supply was exceeding demand around 12:40. Reasons for this aren’t studied in this article. It happened just after the low-priced intervals that neared the floor price of $-1,000 (intervals 12:05 to 12:30).
Be the first to comment on "A look at mainland grid frequency yesterday, November 26th, 2025"