Yesterday, we took a first pass at asking the question ‘How often have we seen these gremlins, injecting ‘phantom’ demand and driving frequency high?’ – a question we’ll return to later.
In this article we’ll focus specifically on the two recent events:
- what happened on on Tuesday 11th November (i.e. two days ago); and
- what happened last week (on Thursday 6th November);
… with both these events showing some marked similarities (though not identical).
Reminders (or pre-reading) …
Before we launch into an exploration of these two events, might be useful to highlight some suggested pre-reading:
A reminder about what actually happens within each Dispatch Interval
Firstly, a reminder to readers that we’ve been progressively building up this series of articles focused on 5 minute Dispatch Intervals … these articles are aimed to help progressively explain and explore some of the complexities therein.
As a step towards explaining what happens within the ‘magic happens’ process at the start of the dispatch interval, we wrote ‘(A first step into the complexities of) the Dispatch Interval in the Real World’ – and readers might like to ensure they are familiar with each of the sub-stages, because it seems that these might be relevant to where the gremlin has emerged.
A reminder about what happens when Supply ≠ Demand
For those who have not read it, you might want to read ‘What happens, when Supply ≠ Demand?’ with the key points being
- that system frequency is a real time guide to imbalance between supply and demand
- with the NEM operating at 50Hz (some other grids internationally are at 60Hz, but the principles are the same).
A reminder about measuring ‘Demand’
Back in April 2018 we published a 1st attempt at ‘An explainer about electricity demand’ … with key points being:
- In real time, grid operators measure ‘demand’ on the supply side (i.e. by adding up injections) rather than trying to add up the (many orders of magnitude more) meters on the consumption side.
- It can do this when the frequency is stable.
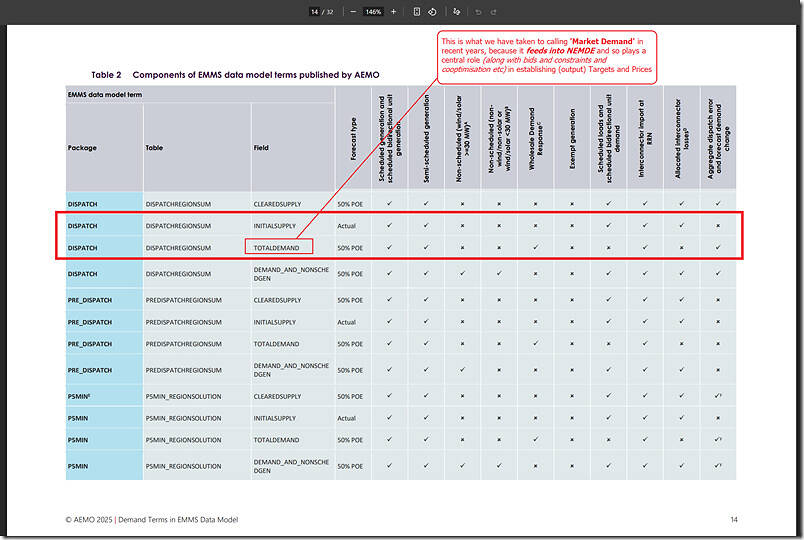
For more complexity, you might like to review the AEMO document ‘Demand terms in the EMMS Data Model’. I’ve lifted out page 14 here in order to emphasise two data series in the DISPATCHREGIONSUM MMS table:
In particular note that what we call ‘Market Demand’:
- Is an input into the NEMDE dispatch process
- That, in simple terms, is calculated for each region by:
- takes data gathered (referred to as step 1a here) to establish ‘What’s the Market Demand at the start of the Dispatch Interval’
- then adds some pre-processing (referred to as step 1b here) to calculate ‘Forecast what the Market Demand at the end of the Dispatch Interval’
- to produce the TOTALDEMAND figure (which we call ‘Market Demand’)
So what’s this calculated ‘Error in INITIALSUPPLY’?
It appeared to us during both events that the ‘Market Demand’ in Victoria had been inflated as a result of some gremlin in the step 1a (data gathering) and/or step 1b (pre-processing) sub-steps, so we wondered what we might be able to do in order to narrow down the source?
Essentially, it’s our understanding that the ‘Market Demand’ for a region is essentially the sum of three (main*) different components – being:
- ‘What’s the Market Demand at the start of the Dispatch Interval’ … which is the sum of:
- Component #1 = ‘injections from (Scheduled and Semi-Scheduled only**) generators inside that region’; plus (minus)
- Component #2 = ‘net metered flows into (or out of) that Region at the start of the Dispatch Interval’; plus
- Component #3 = being ‘increase (or decrease) in that Demand forecast to be the case*** in 5 minutes time’.
* plus some other odds and sods we have ignored here for simplicity.
** for other reasons the AEMO does have visibility (and publish InitialMW for) some Non-Scheduled generators, but these injections don’t count towards ‘Market Demand’
*** which, incidentally, is the root of the concerns raised by the Nelson Review panel about invisible responses.
With this in mind, we wondered whether we could not create a bottom-up calculation (from more granular data in the EMMS) to cross-check with what the AEMO published in the EMMS as pre-aggregated totals.
1) Specifically, in the page from the AEMO’s ‘Demand Terms’ document above you’ll notice the INITIALSUPPLY data field, which is essentially the sum of Component #1 and Component #2 above.
2) So we tried to create a ‘bottom-up’ proxy for the INITIALSUPPLY field published by AEMO as region aggregate, using:
(a) Injections (not withdrawals) from Scheduled and Semi-Scheduled units in the region … using INITIALMW values
(b) plus net imports to that region … using METEREDMWFLOW data
3) We then created an ‘Error in Initial Supply’ calculation by starting with our bottom-up calc, and subtracting the AEMO’s aggregate number
… the theory being that they should be very similar, if our logic is correct.
So we did … and here’s the results of an ‘Error in INITIALSUPPLY for Victoria’ calculation that spans all dispatch intervals over 6 days from Thursday 6th November 2025 through until Tuesday 11th November 2025:
What’s pleasing to us is that:
1) Over this time-range, or bottom-up calculation lines up very well with AEMO’s published INITIALSUPPLY (i.e. the ‘error’ is zero most of the time).
… which gives us some confidence that we’re on the right track
2) Furthermore, the two periods of deviations (i.e. non-zero ‘error’) line up well with the two events we’ve previously noted.
So we zoom in…
Four hours on Thursday 6th November 2025
In the article ‘A quick look at ‘Dispatch Error’ on Thursday 6th November 2025, in conjunction with the Frequency Spike’ there’s a tabulated summary of 6 dispatch intervals that are the focus:
- 12:25 … which appears to be the last ‘normal’ dispatch interval before the gremlin struck
- Four dispatch intervals (12:30, 12:35, 12:40, 12:45) with the gremlin at work
- 12:50 … with the gremlin removed, then allowing frequency to progressively recover as Targets ramped ramped down to more ‘reasonable’ levels.
In the four-hour time-range below, the 4 dispatch intervals with gremlins in the works line up perfectly and the escalating error speaks to the step-wise degradation in frequency control:
This gives us good confidence that we’re on the right track.
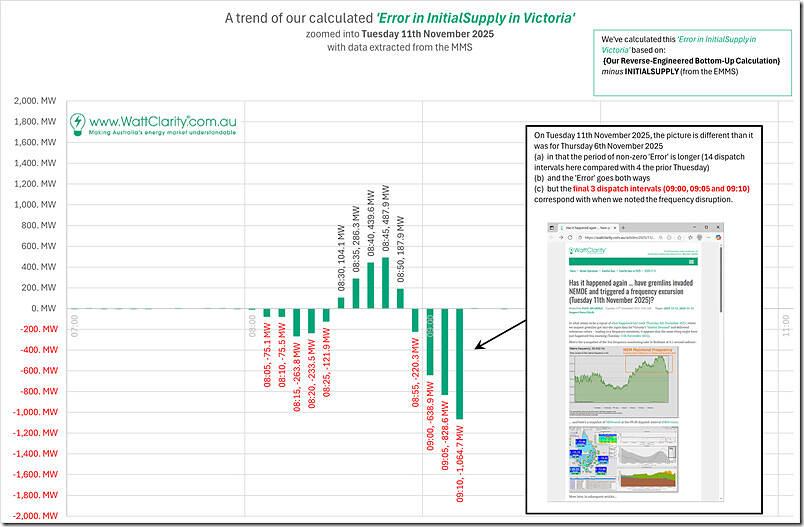
Four hours on Tuesday 11th November 2025
With respect to the apparent gremlins on Tuesday 11th November, we’d not yet done as much analysis of what happened through the morning period as we did for the Thursday prior.
So the length of the non-zero ‘error’ numbers here was a surprise, when zooming into this four-hour period:
Also a surprise was the way in which the direction of the error changed across the 14 dispatch intervals highlighted.
However the fact that the last three dispatch intervals were largest and lined up with the frequency excursion, also give us some confidence in the method.
So, what’s the transient gremlin affecting INITIALSUPPLY?
Unfortunately we don’t have an answer for that yet… (we have a few theories, but we won’t send our readers down what may well be rabbit holes before more exploration).


Be the first to comment on "Trying to understand the errors in ‘Initial Supply’ (on Tue 11th and Thu 6th November) as the source of the gremlins"