Seems like ages ago (but was just a few days) that we noted the ‘New all-time record for NEM-wide wind, on Monday 23rd June 2025’.
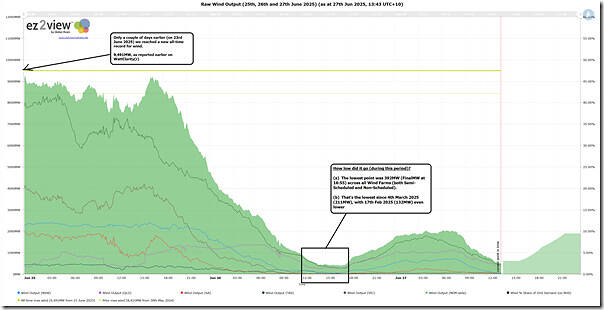
Several readers have commented there that the wind dropped afterwards (and that it was a contributor to recent volatility – particularly on Thursday 26th June 2025). So it’s worth taking the same ez2view Trend Query and ‘zooming in’ to look at just the past 3 days
Here’s the trend:
As noted on the chart:
1) On Thursday 26th June 2025 the NEM-wide wind production hit a ‘lowest in recent days’ point:
(a) At 392MW for the 16:55 dispatch interval (NEM time)
(b) Which happens to be 5 minutes after I’d posted about how the ‘Run of evening volatility starts early, on Thursday 26th June 2025’
2) But note that there were two other (lower) points noted, earlier in calendar 2025:
(a) A lower point on 4th March 2025 (at 211MW)
(b) An even lower point on 17th February 2025 (at 132MW)
… though readers should remember that the reason the wind yield might be low could be for a combination of different reasons – principally:
i. Low wind conditions; but also
ii. ‘Economic Curtailment’ (e.g. if these low points happened in the middle of the day when solar (small and large) was driving negative prices below ‘negative LGC’); and/or
iii. ‘Network Curtailment’.
3) And I’ve not looked in years gone past…


Thanks Paul
It’s really quite amazing how widespread Aus weather conditions are-high or low wind speeds seem to occur simultaneously across half a continent; some of these farms are over 2000km from each other!
I never realised this until the advent of wind generation. Presumably applies to the nearby coastal waters also.