Wednesday evening 11th June 2025 was a period of tight supply-demand balance, hence volatility – and so we’ve already provided this ‘Brief summary of outcomes (Price, Demand and IRPM) for Wednesday evening 11th June 2025’.
So as a next step in understanding what happened over the same ~4 hour period of particular interest, I’ve grabbed the ‘Bids & Offers’ widget in ez2view and:
- time-travelled back to 24:00 ending Wednesday evening 11th June 2025;
- and set the look-back period to 48 hours, in order that we can also see Tuesday 10th June 2025 as a comparison point.
We’ll walk quickly through the bids by fuel ‘type’ in this article at a NEM-wide aggregate level … but this is really just intended to illuminate a few high-level observations that might lend to some discrete deeper dive(s) later.
(A) NEM-wide summary, all units
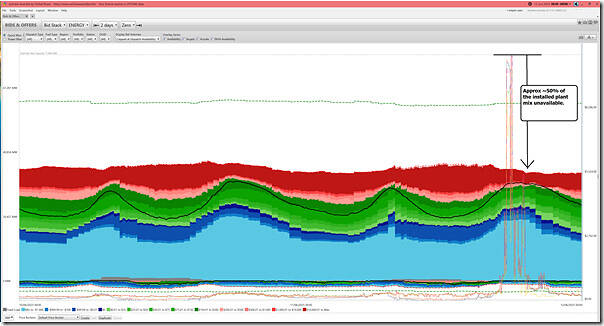
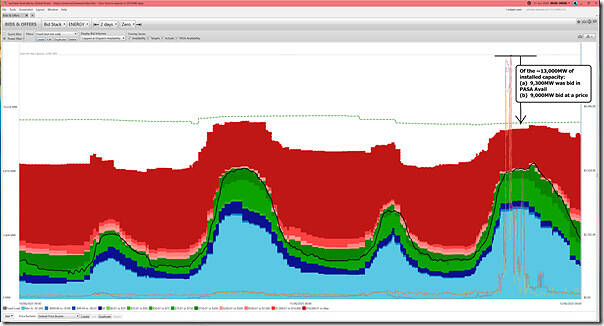
Adding up all units (i.e. Scheduled and Semi-Scheduled, remember that Non-Scheduled do not bid and that there’s also a growing amount of even-more-invisible contributions) we see the following:
Briefly:
1) Remember that (post-IESS) consumption side bids are below the line …for BESS and pumping for hydro
2) In terms of installed capacity registered with AEMO, there’s 71,806MW (i.e. MaxCapacity, noting these considerations)
3) But only above half of that was available!
(B) VRE units
Let’s start with the VRE units supplying ‘Anytime/Anywhere Energy’.
B1) Solar units
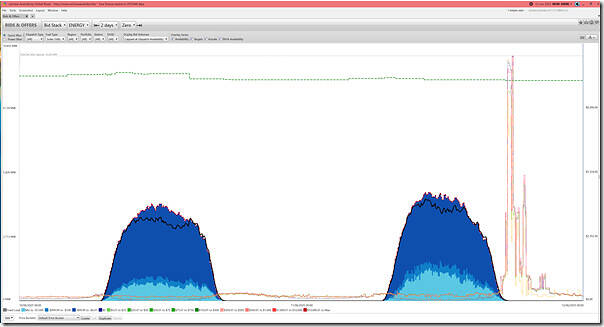
Briefly, here’s the chart for solar:
No surprise here that the volatility occurred in the early winter evening, once the solar had set.
B2) Wind units
Flipping to look at the wind units, we see the following:
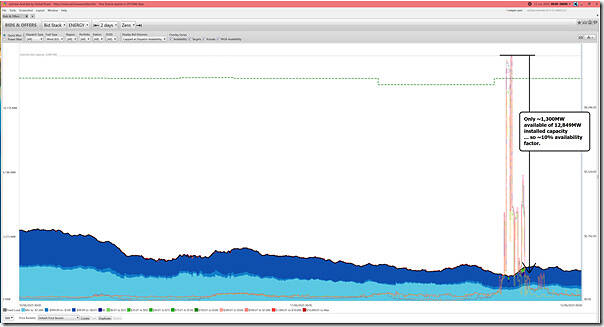
In this chart we can see that:
1) Of the 12,849MW registered with AEMO as installed capacity (i.e. MaxCapacity, noting these considerations) we see only ~1,300MW with energy-constrained availability
(a) which calculates as only ~10% availability factor.
(b) so low wind is clearly a factor.
2) Note the dotted green line (PASA Availability) was at 11,671MW … which seems to indicate a maximum of ~1,200MW in commissioning.
(C) Firming units
Let’s now shift focus, to look at various types of firming capacity.
C1) Coal units
On Tuesday morning we’d posted about the ‘Unplanned outage at YWPS3 (tube leak) extended (due to air duct collapse)’ – and, in doing so, had included a snapshot from the ‘Generator Outages’ widget in ez2view filtered down to look at the 44 x coal-fired units still operational across the NEM.
The top part of the image was truncated in the scroll, but in the broader picture we could see (for Wednesday 11th June 2025):
1) Three units on planned outages (Callide B2, Gladstone 1, Tarong North)
2) Four other units on unplanned outages (Bayswater 4, Loy Yang A1, Yallourn 3 … and YWPS4, which came back online last night (but after the volatility … and with the RTS subsequently short-lived)).
3) So 7 units out, of 44 in total (37 online and operating)
Keep this information in mind when we see the following:
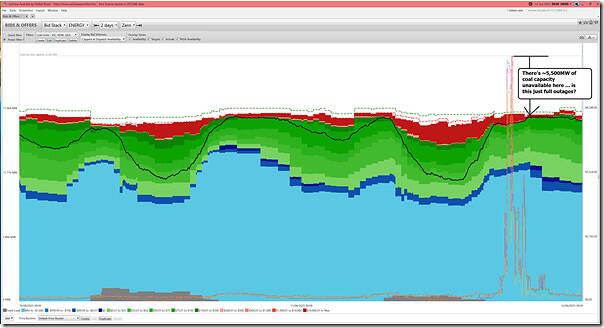
With this chart we see:
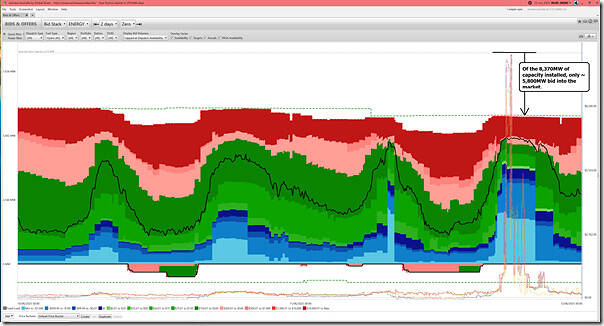
1) That there’s ~5,500MW of coal capacity unavailable over this 2-day period
(a) which seems to be more than would be the case just accounting for the 7 units offline
(b) so leading to questions about units only partially available.
2) Of the capacity bid into the market, there was a slight increase in capacity bid at ‘price making’ price bands during the volatile period.
C2) Fossil units (but not coal)
Lumping together the gas and liquid fuelled units, we see the following:
Across all of these units, we see:
1) Approximately 4,000MW of the 12,982MW of installed capacity was unavailable for reasons not explored.
2) Whilst ~6,700MW was bid to run during the volatile period, the remaining (~2,300MW) capacity was bid at or above $10,000/MWh.
C3) Hydro
Remembering that this is hydro units across the NEM, here’s the trend:
In this case:
1) Remember that (post-IESS) consumption side bids are below the line … i.e. for pumping at the 3 x pumped hydro sites.
2) In this case we see ~2,500MW of capacity installed that was not bid into the market through this period.
3) Of the capacity that did bid, much of it was shifted to ‘price taker’ bid bands for the period of the price spike.
C4) Batteries
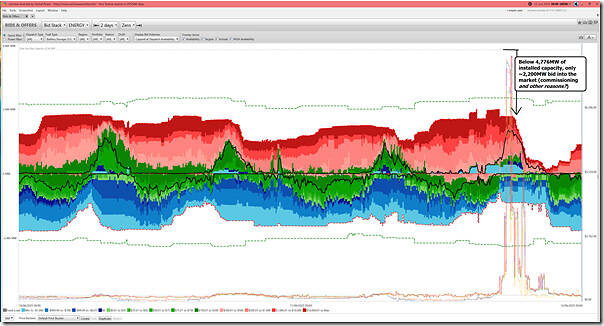
Here’s the same filtered view for batteries … remembering that (post-IESS) consumption side bids are below the line:
Quick notes:
1) There’s a sizeable amount of capacity (i.e. ~2,500MW) that’s registered in the MMS as installed capacity (i.e. MaxCapacity, noting these considerations) that was not bid into the market:
(a) Clearly a sizeable amount would be related to batteries still in commissioning;
(b) But I’ve not yet looked to see if there are other reasons as well.
2) For those who’ve expressed concerns about range anxiety with respect to the growing BESS fleet, some good news here is that the aggregate discharge profile lasted longer than the period of highest prices
(a) i.e. steepest decline did not commence till 19:00 …
(b) which we can see here was both:
i. After the highest prices,
ii. But also before the lowest point of IRPM (i.e. the decline of BESS availability presumably helped to trigger the lowest point of IRPM).
3) Of the capacity that did bid, much of it remained in ‘price maker’ bid bands for the period of the price spike.
C5) Negawatts
About a month ago I’d written ‘AEMC underway with review of the Centralised Negawatt Dispatch Mechanism (a.k.a. the WDRM), and consultation closed’ and, in the process, expressed my own long-standing concerns about the WDRM initiative.
So readers won’t be surprised in these three key observations here:
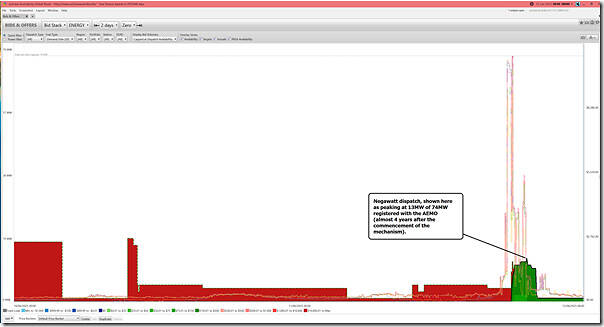
1) Almost four years after the commencement of the rule, there’s only 74MW registered in the NEM across all regions;
2) Of this capacity, utilisation peaked at 13MW (~18%).
3) First dispatch (at 17:55) was 30 minutes after the volatility commenced.


Leave a comment