Last Friday afternoon (31st January 2025) we noted briefly about a ‘(Mysterious and) Large drop in NSW ‘Market Demand’ late afternoon Friday 31st January 2025, prompting questions … part 1’.
1) At that point in time we were thinking it was a genuine drop in demand … and a very sizeable (but mysterious) one
2) However questions from others (and a bit of time to dig further) had us re-assessing…
So on Monday we posted the follow-on as part 2 ‘Last Friday’s large and (mysterious) apparent drop in NSW ‘Market Demand’ appears some data glitch?’.
Our Current Hypothesis
As far as I’ve seen, there’s been no declaration yet from the AEMO that there was a Scheduling Error … but we’re working on the hypothesis (as noted in Part 2) as follows …
‘… is that there was some sort of data glitch:
(a) Which might have commenced around ~16:30:
i. at which point the AEMO began to see ‘phantom’ demand increase that was not there
ii. hence dispatching more supply than was necessary
iii. hence leading to the rise in frequency
(b) But from 17:15 a correction was made:
i. The phantom demand was removed
ii. The ‘not needed’ supply was ramped back, and frequency reverted to ~50Hz.’
… though we note others have speculated the glitch might have started earlier.
Questions about Cause of the Error, and Rectification?
Assuming that the above hypothesis is correct (and we still don’t know if that is the case), then we have questions about:
Q1) What caused the error in the first place; and then
Q2) How did the AEMO recognised the error had occurred …
Q3) And then what specific remediation action was taken (i.e. how was the phantom demand removed?)
However we’re not going to explore these questions in this article.
What kept the frequency (relatively) stable, if pumping in additional supply to meet phantom demand?
Instead, in this article we wonder (referencing the frequency trends in the part 2 article) what kept the frequency relatively restrained, given:
1) (in our hypothesis) Targets were given for ~1,000MW more supply than was actually there in demand?
2) Which many readers will understand would have ordinarily had frequency ramping up quickly from 50Hz and ongoing through the roof … at least until contingency measures kicked in (firstly Contingency FCAS and then potentially automated over-frequency tripping or worse).
Note that:
1) ~1,000MW more supply than required would have represented ~3-4% of total consumption, so not an insignificant amount …
2) and (if the hypothesis is true, which is a big assumption) injected on a sustained basis from (perhaps!) 16:30 to 17:15 I would have thought that frequency would have shot through the roof (well above the NOFB) and triggered all sorts of responses.
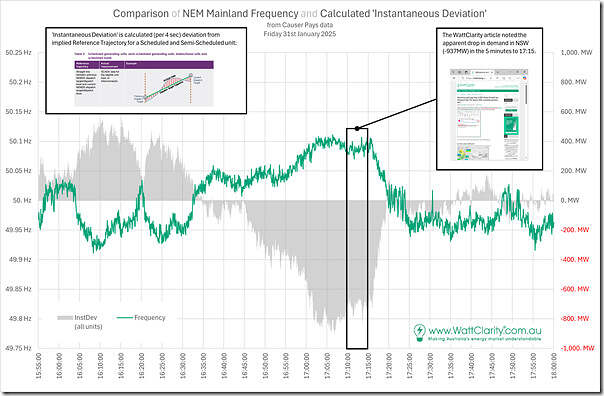
So, with a bit of help from others in the team, we’ve utilised some of the newer data in the EMMS with the Data Model v5.4 upgrade (preparing for the implementation of Frequency Performance Payments in June 2025) took a trended look at what we’ve termed as ‘Instantaneous Deviation’:
1) Which is calculated on a 4-second cadence between 15:55 and 18:00 (i.e. the zoomed in period of interest from part 2).
2) Utilising the inferred Target-to-Target straight line trajectory:
(a) that’s used in Causer Pays and
(b) also in the new Frequency Performance Payments methodology that we’re transitioning to in June 2025.
(c) but, it should be noted, is different than the FinalMW to Target trajectory that’s used for other purposes in NEMDE dispatch.
3) Comparing this to the ‘actual Output’ data for all units in SCADA snapshots on a 4-second cadence to calculate:
Instantaneous Deviation = Implied Target (instantaneous) – Actual Output (instantaneous) … so
(a) a negative number is producing under (Instantaneous) Target
(b) a positive number is producing over (Instantaneous) Target
… i.e. structured the same way as ‘Dispatch Error’, but utilising a different derivation of (Instantaneous) Target.
4) Then we aggregated across all units.
Remembering that the frequency measurements in our office are on a 0.1s cadence (as used in part 2), we’ve discounted them and instead used the similar 4-second cadence data the AEMO has published (to line up with the calculated ‘Instantaneous Deviation’) to produce the following summary chart:
With respect to this, two main points can be made:
Take-away #1) The fact that the total negative ‘Instantaneous Deviation’ (in part delivered by PFR and Regulation FCAS) added to as much as ~900MW …
(a) coincidentally in the 5 minute period before the ~900MW elimination of ‘phantom demand’ (according to our current hypothesis) …
(b) we think this supports the current hypothesis.
… or are we missing something?
Take-away #2) Cue the headline …
‘Primary Frequency Response saves the day’?!
… nah, something so esoteric as that does not get many headlines. But here’s another example of how it’s been very useful.
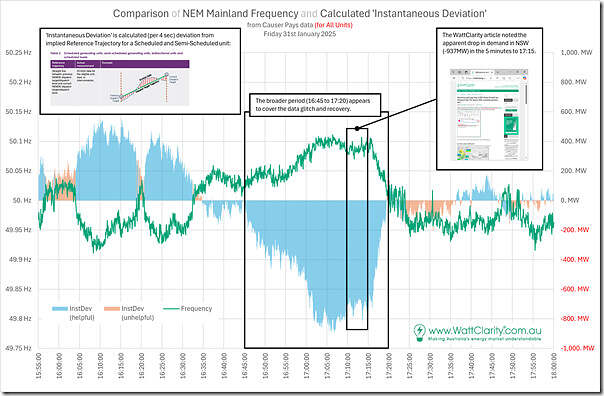
Making this more easily understandable, we’ve filtered the ‘Instantaneous Deviation’ into two categories:
1) Category 1 = Helpful (i.e. did it help to move the frequency back towards 50Hz?) …
(a) If the frequency was below 50Hz, was the ‘Instantaneous Deviation’ a positive number?
(b) If the frequency was above 50Hz, was the ‘Instantaneous Deviation’ a negative number?
2) Category 2 = Unhelpful (i.e. where it tended to push the frequency further away from 50Hz) …
(a) If the frequency was below 50Hz, was the ‘Instantaneous Deviation’ a negative number?
(b) If the frequency was above 50Hz, was the ‘Instantaneous Deviation’ a positive number?
Hence creating this clearer trend…
In summary across all units we see that the assistance provided (by PFR + Regulation FCAS) was beneficial for almost all of the 4 second time slices included over this ~2 hour period.
Which is a very good thing, as (if our hypothesis is correct) it helped to stop the frequency blowing through the roof.
What about for each Fuel/Technology type … which ones helped (and which ones didn’t)?
So let’s walk through each technology/fuel type in turn to see what these trends looked like in terms of helpful or not. Note that the y2 axis needs to be different scales in different charts!
Four-second response across all Coal Units (helpful or not?)
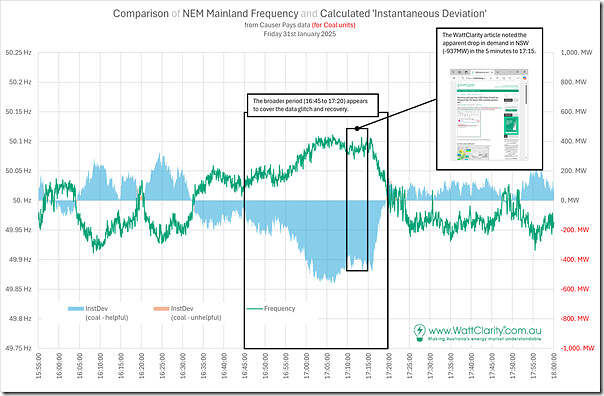
Here’s the filtered down trend for coal units:
We see that:
1) Through the vast majority of 4-second time-slices, the (PFR + Regulation FCAS) contribution in ‘Instantaneous Deviation’ across the coal fleet was beneficial to frequency
2) During the ‘peak’ dispatch interval prior to the correction, total beneficial response was ~500MW of the ~900MW of total response across all units.
(a) So a sizeable contribution
(b) But then, I have not checked the specifics, but would expect coal would have been contributing a sizeable percentage of the energy mix during that period in the afternoon anyway
Four-second response across all Gas + Liquid (helpful or not?)
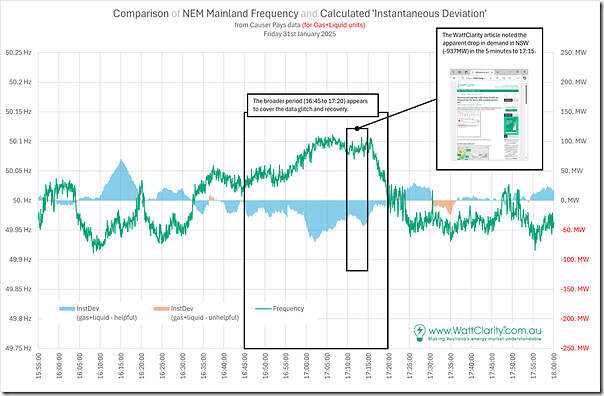
Here’s the filtered down trend for gas+liquid units:
We see that:
1) Through the vast majority of 4-second time-slices, the (PFR + Regulation FCAS) contribution in ‘Instantaneous Deviation’ across the Gas+Liquid fleet was beneficial to frequency
2) During the ‘peak’ dispatch interval prior to the correction, total beneficial response was ~50MW of ~900MW of total response across all units:
(a) so much smaller than the effect of the coal units.
(b) but I have not looked into how much capacity was running (e.g. to do some ‘percentage of running’ ratio).
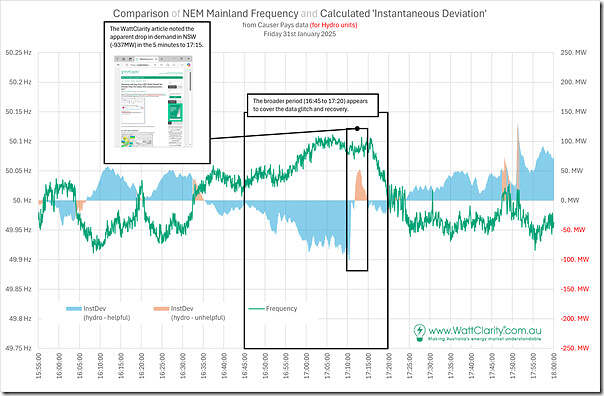
Four-second response across all Hydro (helpful or not?)
Here’s the filtered down trend for hydro units:
We see that:
1) Through the vast majority of 4-second time-slices, the (PFR + Regulation FCAS) contribution in ‘Instantaneous Deviation’ across the hydro fleet was beneficial to frequency
2) During the ‘peak’ dispatch interval prior to the correction, total beneficial response was ~50MW of ~900MW of total response across all units:
(a) so much smaller than the effect of the coal units.
(b) again I have not looked into how much capacity was running (e.g. to do some ‘percentage of running’ ratio).
3) Something strange stands out in the 17:15 dispatch interval, but I’ve not looked into it.
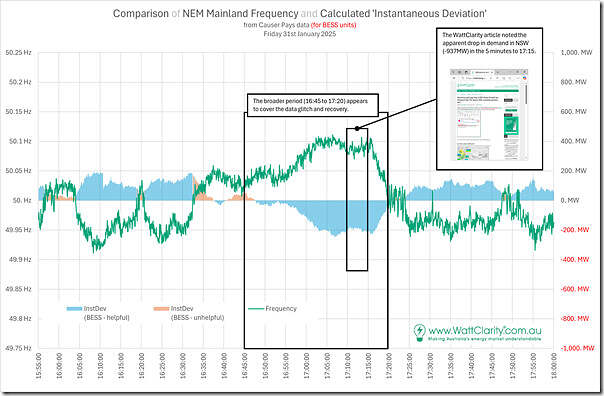
Four-second response across all BESS (helpful or not?)
Here’s the filtered down trend for BESS units (i.e. now all BDUs following implementation of IESS):
We see that:
1) Through the vast majority of 4-second time-slices, the (PFR + Regulation FCAS) contribution in ‘Instantaneous Deviation’ across the BESS fleet was beneficial to frequency
2) During the ‘peak’ dispatch interval prior to the correction, total beneficial response was ~200MW of ~900MW of total response across all units:
(a) so much smaller than the effect of the coal units (but larger than Gas + Liquid + Hydro combined).
(b) again I have not looked into how much capacity was running
i. e.g. to do some ‘percentage of running’ ratio
ii. Gut feeling is that this ratio would be impressive for batteries.
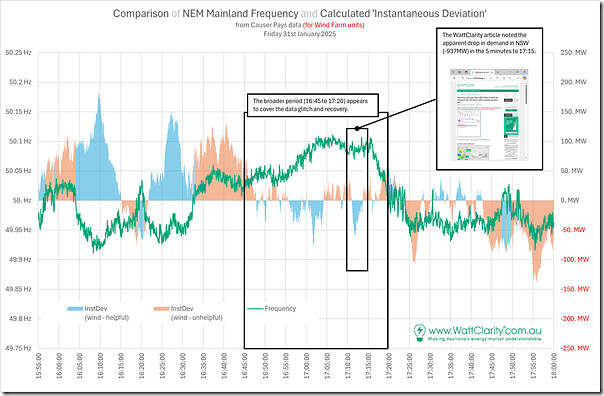
Four-second response across all Wind (helpful or not?)
Here’s the filtered down trend for Wind Farms units:
We see that:
1) In contrast to all of the ‘firming’ technology types above:
(a) in simple numerical terms:
i. there were more 4-second time slices (i.e. 1094) over the period where the the (PFR + Regulation FCAS) contribution in ‘Instantaneous Deviation’ was detrimental to frequency
ii. then there were 4-second time slices (i.e. 787) that were beneficial!
iii. that’s a ratio of Detrimental-to-Beneficial of 139%
(b) furthermore, in volumetric terms (i.e. area under the curves over 2 hours) the Detrimental-to-Beneficial ratio is even higher, at 142%.
(c) Now, there might have been other factors at work (for instance, perhaps the games sometimes played in self-forecasting played a role) … but more fundamentally I believe this speaks to the fundamental difficulty of accurately forecasting the VRE (wind) resource.
2) During the ‘peak’ dispatch interval prior to the correction, total response was mixed, and small in size.
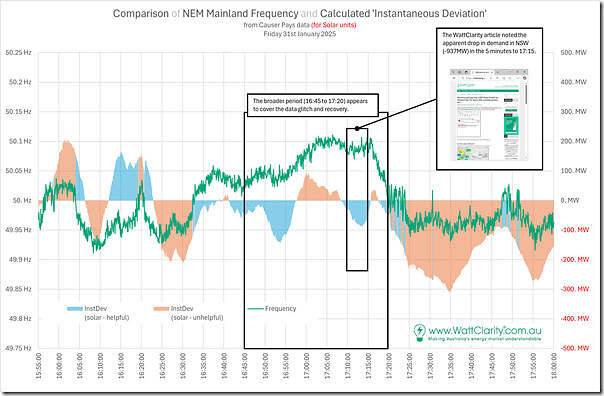
Four-second response across all Solar (helpful or not?)
Here’s the filtered down trend for Solar Farm units:
We see that:
1) As for Wind, and in contrast to all of the ‘firming’ technology types above:
(a) in simple numerical terms:
i. there were more 4-second time slices (i.e. 1130) over the period where the the (PFR + Regulation FCAS) contribution in ‘Instantaneous Deviation’ was detrimental to frequency
ii. then there were 4-second time slices (i.e. 751) that were beneficial!
iii. that’s a ratio of Detrimental-to-Beneficial of 150%
(b) furthermore, in volumetric terms (i.e. area under the curves over 2 hours) the Detrimental-to-Beneficial ratio is even higher, at 314%.
(c) Again, there might have been other factors at work (for instance, perhaps the games sometimes played in self-forecasting played a role) … but more fundamentally I believe this speaks to the fundamental difficulty of accurately forecasting the VRE (solar) resource.
2) During the ‘peak’ dispatch interval prior to the correction, total response was mixed, but quite sizeable at times (either beneficial or detrimental).


Leave a comment