There’s been a few articles about the closure of the 18MW Codrington Wind Farm in recent times.
Particularly notable to me were:
1) On 10th February (last Monday) Rachel Williamson wrote ‘Australia’s oldest commercial wind farm to close as cost of repowering is too high’ on RenewEconomy.
2) But I particularly enjoyed reading Carl Daley’s* personal reflections ‘End of era for pioneer wind farm’ this morning
* geez, Carl, you’re a grandfather!
These articles (and others) prompted me to want to take a look at the performance of the Codrington Wind Farm over the years.
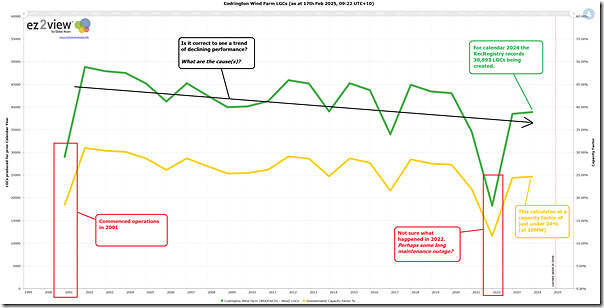
Reaching first for our newly released GSD2024, I was reminded that there’s no coverage of that wind farm in there (or other similar ones) because the AEMO does not publish data for it (i.e. it’s too small for the AEMO to pay it particular attention). But I remembered that we also include data from the CER’s Rec Registry in terms of LGC creation/registration data on an annual basis in the ‘Trends Engine’ within ez2view, so I had a quick look and produced the following:
Now, I really don’t spend much time at all looking at LGCs, so may have made some newbie mistakes here – but to me it seems like:
1) The low production in 2001 (28,864 LGCs) was because the station was only operational part-way through the year sometime
… I don’t know exactly when
2) The next year (2002) was the year of highest LGC production (48,818LGCs), which I have roughly calculated back to a capacity factor of just below 31% (assuming an installed capacity of 18MW).
3) Since that time:
(a) It appears as if the wind farm suffered a pretty steady decline in performance;
(b) I don’t have time (or any more data!) to delve intop possible reasons for the decline
… but if there were some knowledgeable readers out there who could help, I’d be most appreciative if you could share more context in comments below (or one-on-one):
i. Was this a real decline in performance
ii. If so, what were the contributing factors?
4) For reasons unknown, 2022 was a year of particularly bad performance.
5) The last year (calendar 2024) saw production down to 48,893 (oops) 38,893 LGCs and capacity factor ~24% (as noted on the chart above).
PS1 MLFs one factor
Worth flagging that (over on LinkedIn here) David Osmond pointed out that a decline in MLF for the unit will be one factor in the decline of the deemed LGC production.


Wind farms just like solar farms will see continual degredation throughout their life.
https://www.ref.org.uk/publications/280-analysis-of-wind-farm-performance-in-uk-and-denmark
Some of this is driven by general wear and tear but also by the addition of new wind farms which results in reduction of wind energy in the area.
Shouldn’t your 24% load factor at 18mw be 37,843 GWh / LGC, not 48,893?
Best wishes
Julian Barton
Yes, there was a mistake in the text but not in the chart – it was 38,893 LGCs in 2024 (not 48,893 LGC) … corrected now.