Last week, we reported that the Federal Government announced the list of winners from the latest Capacity Investment Scheme (CIS) tender. As I mentioned when reporting the news, it was noteworthy that 11 of the 19 winners were standalone generation projects (i.e. without a co-located battery). This raised some eyebrows in our office, given the major headwinds that have been facing existing projects of this nature for several years, as I recently summarised here.
In response to that article, Ben Skinner commented, “It might be interesting to plot these projects on a map also showing known areas of congestion”.
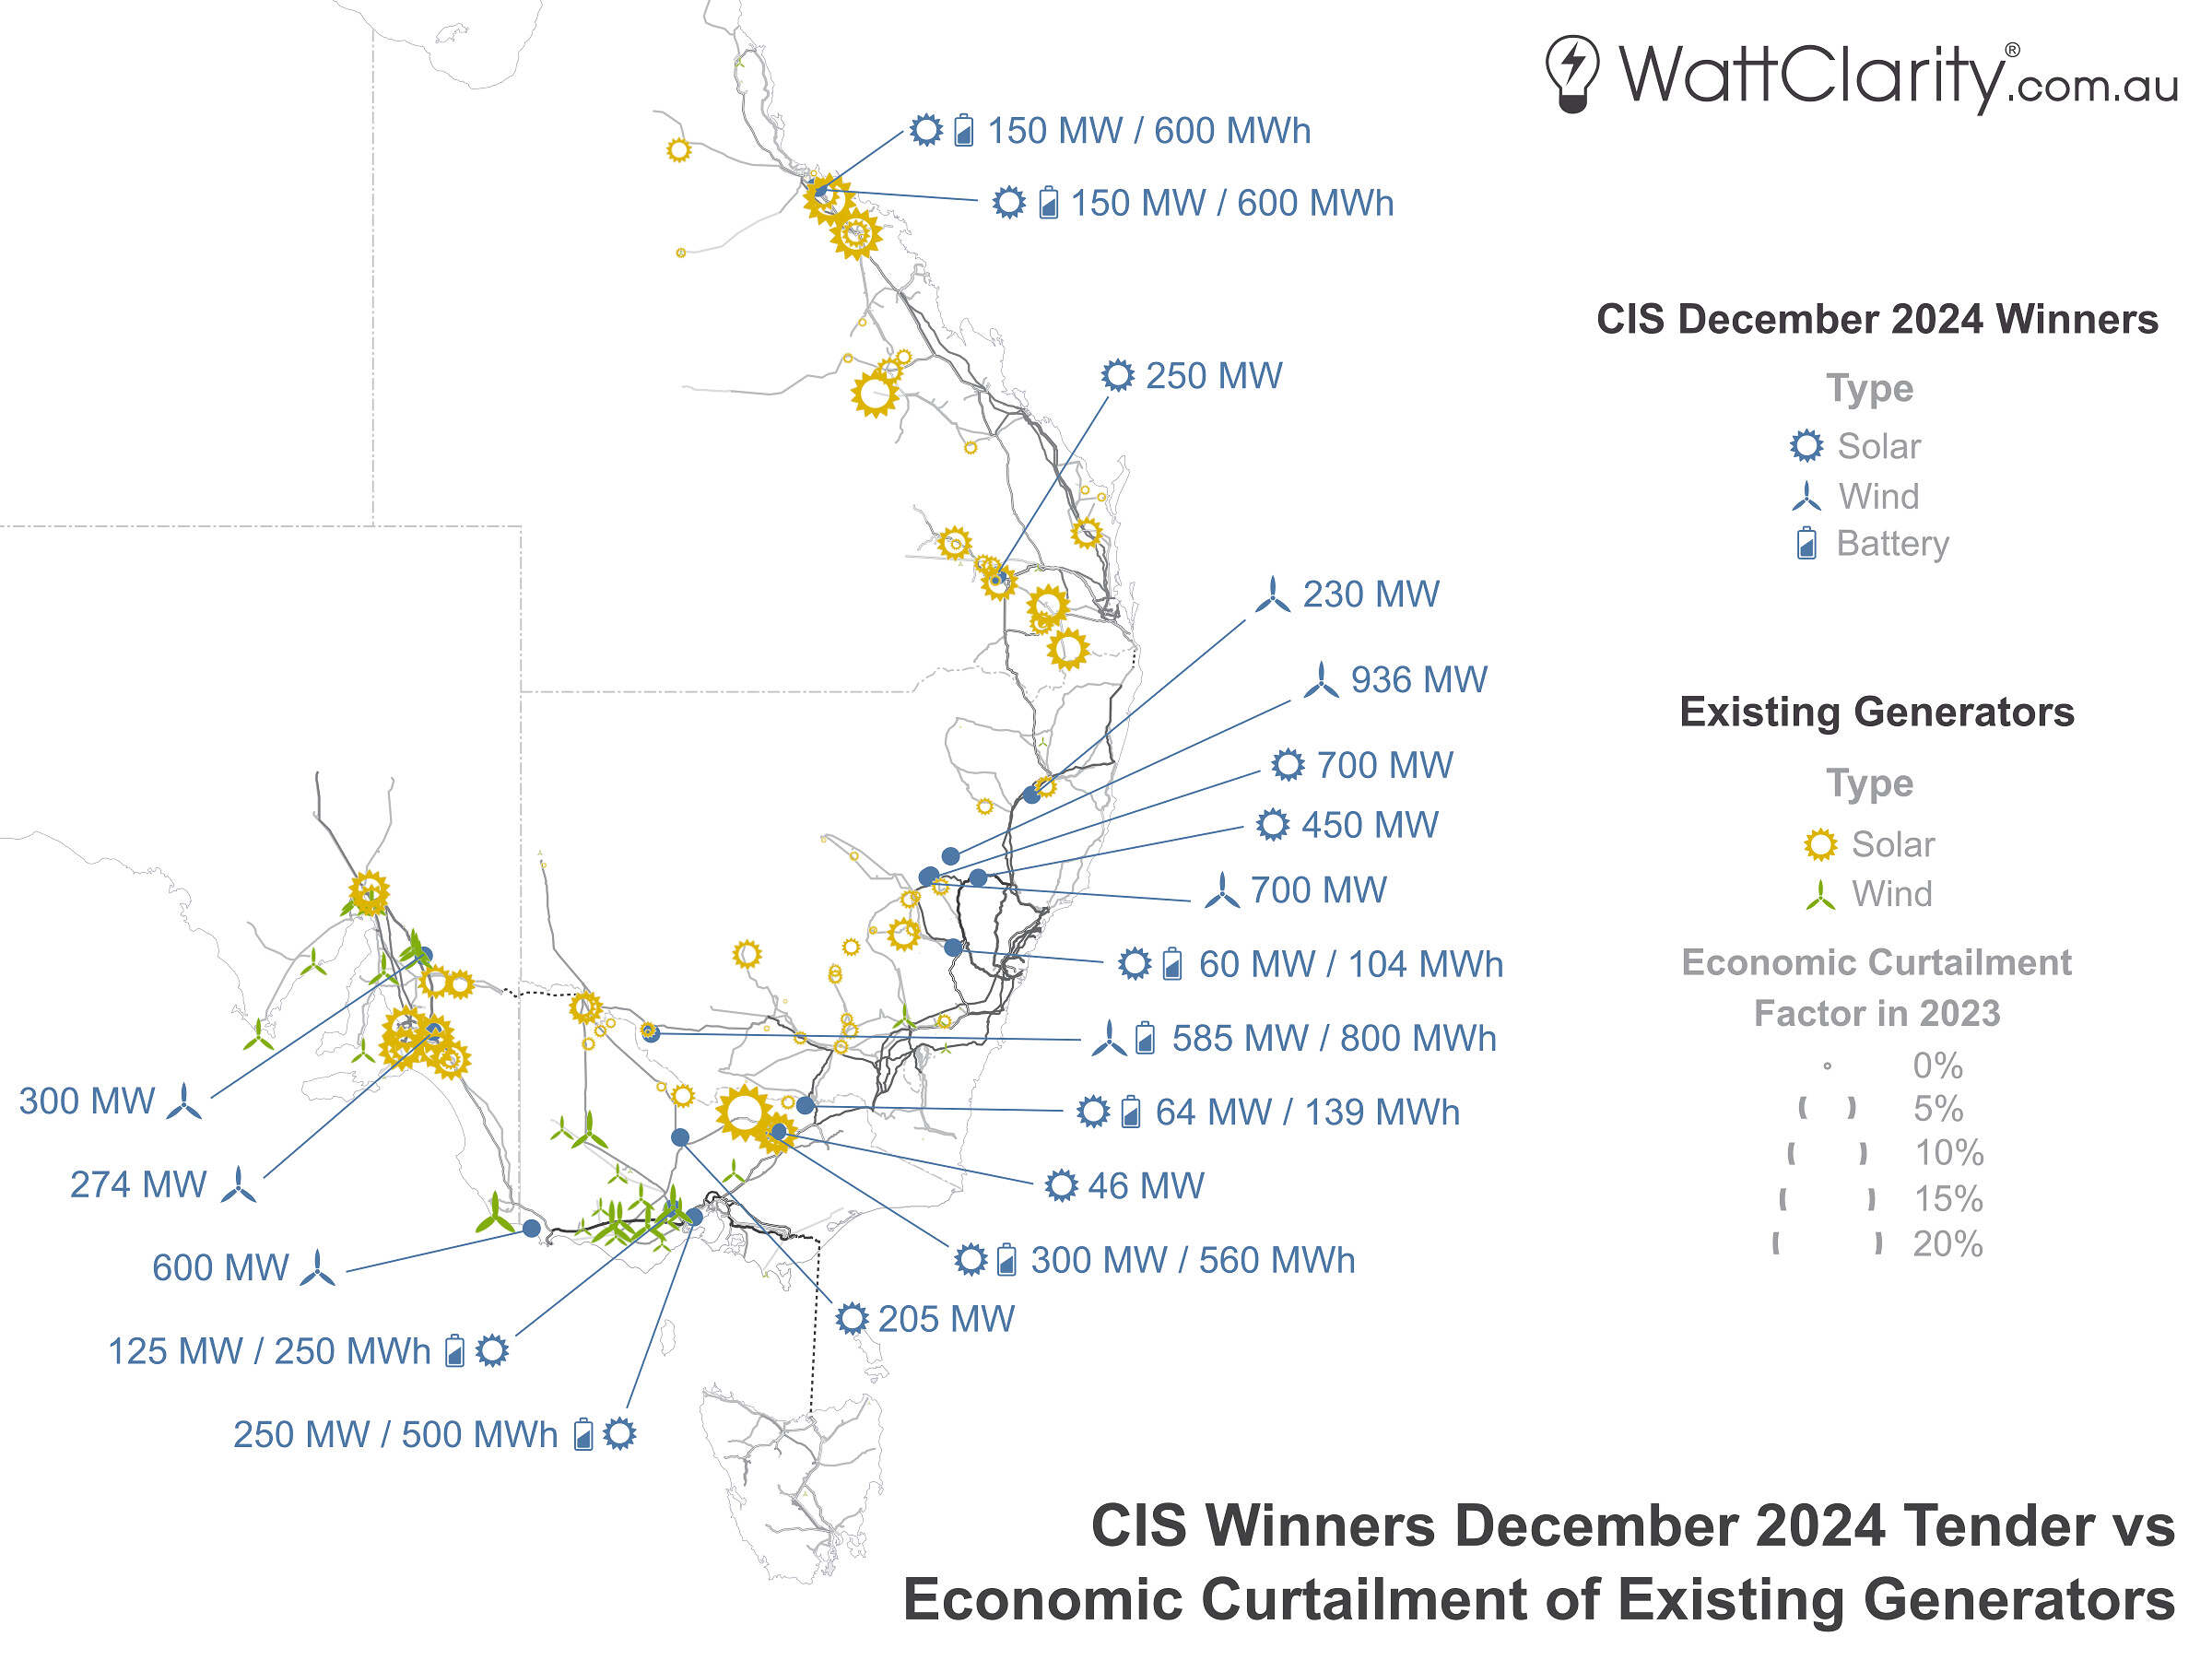
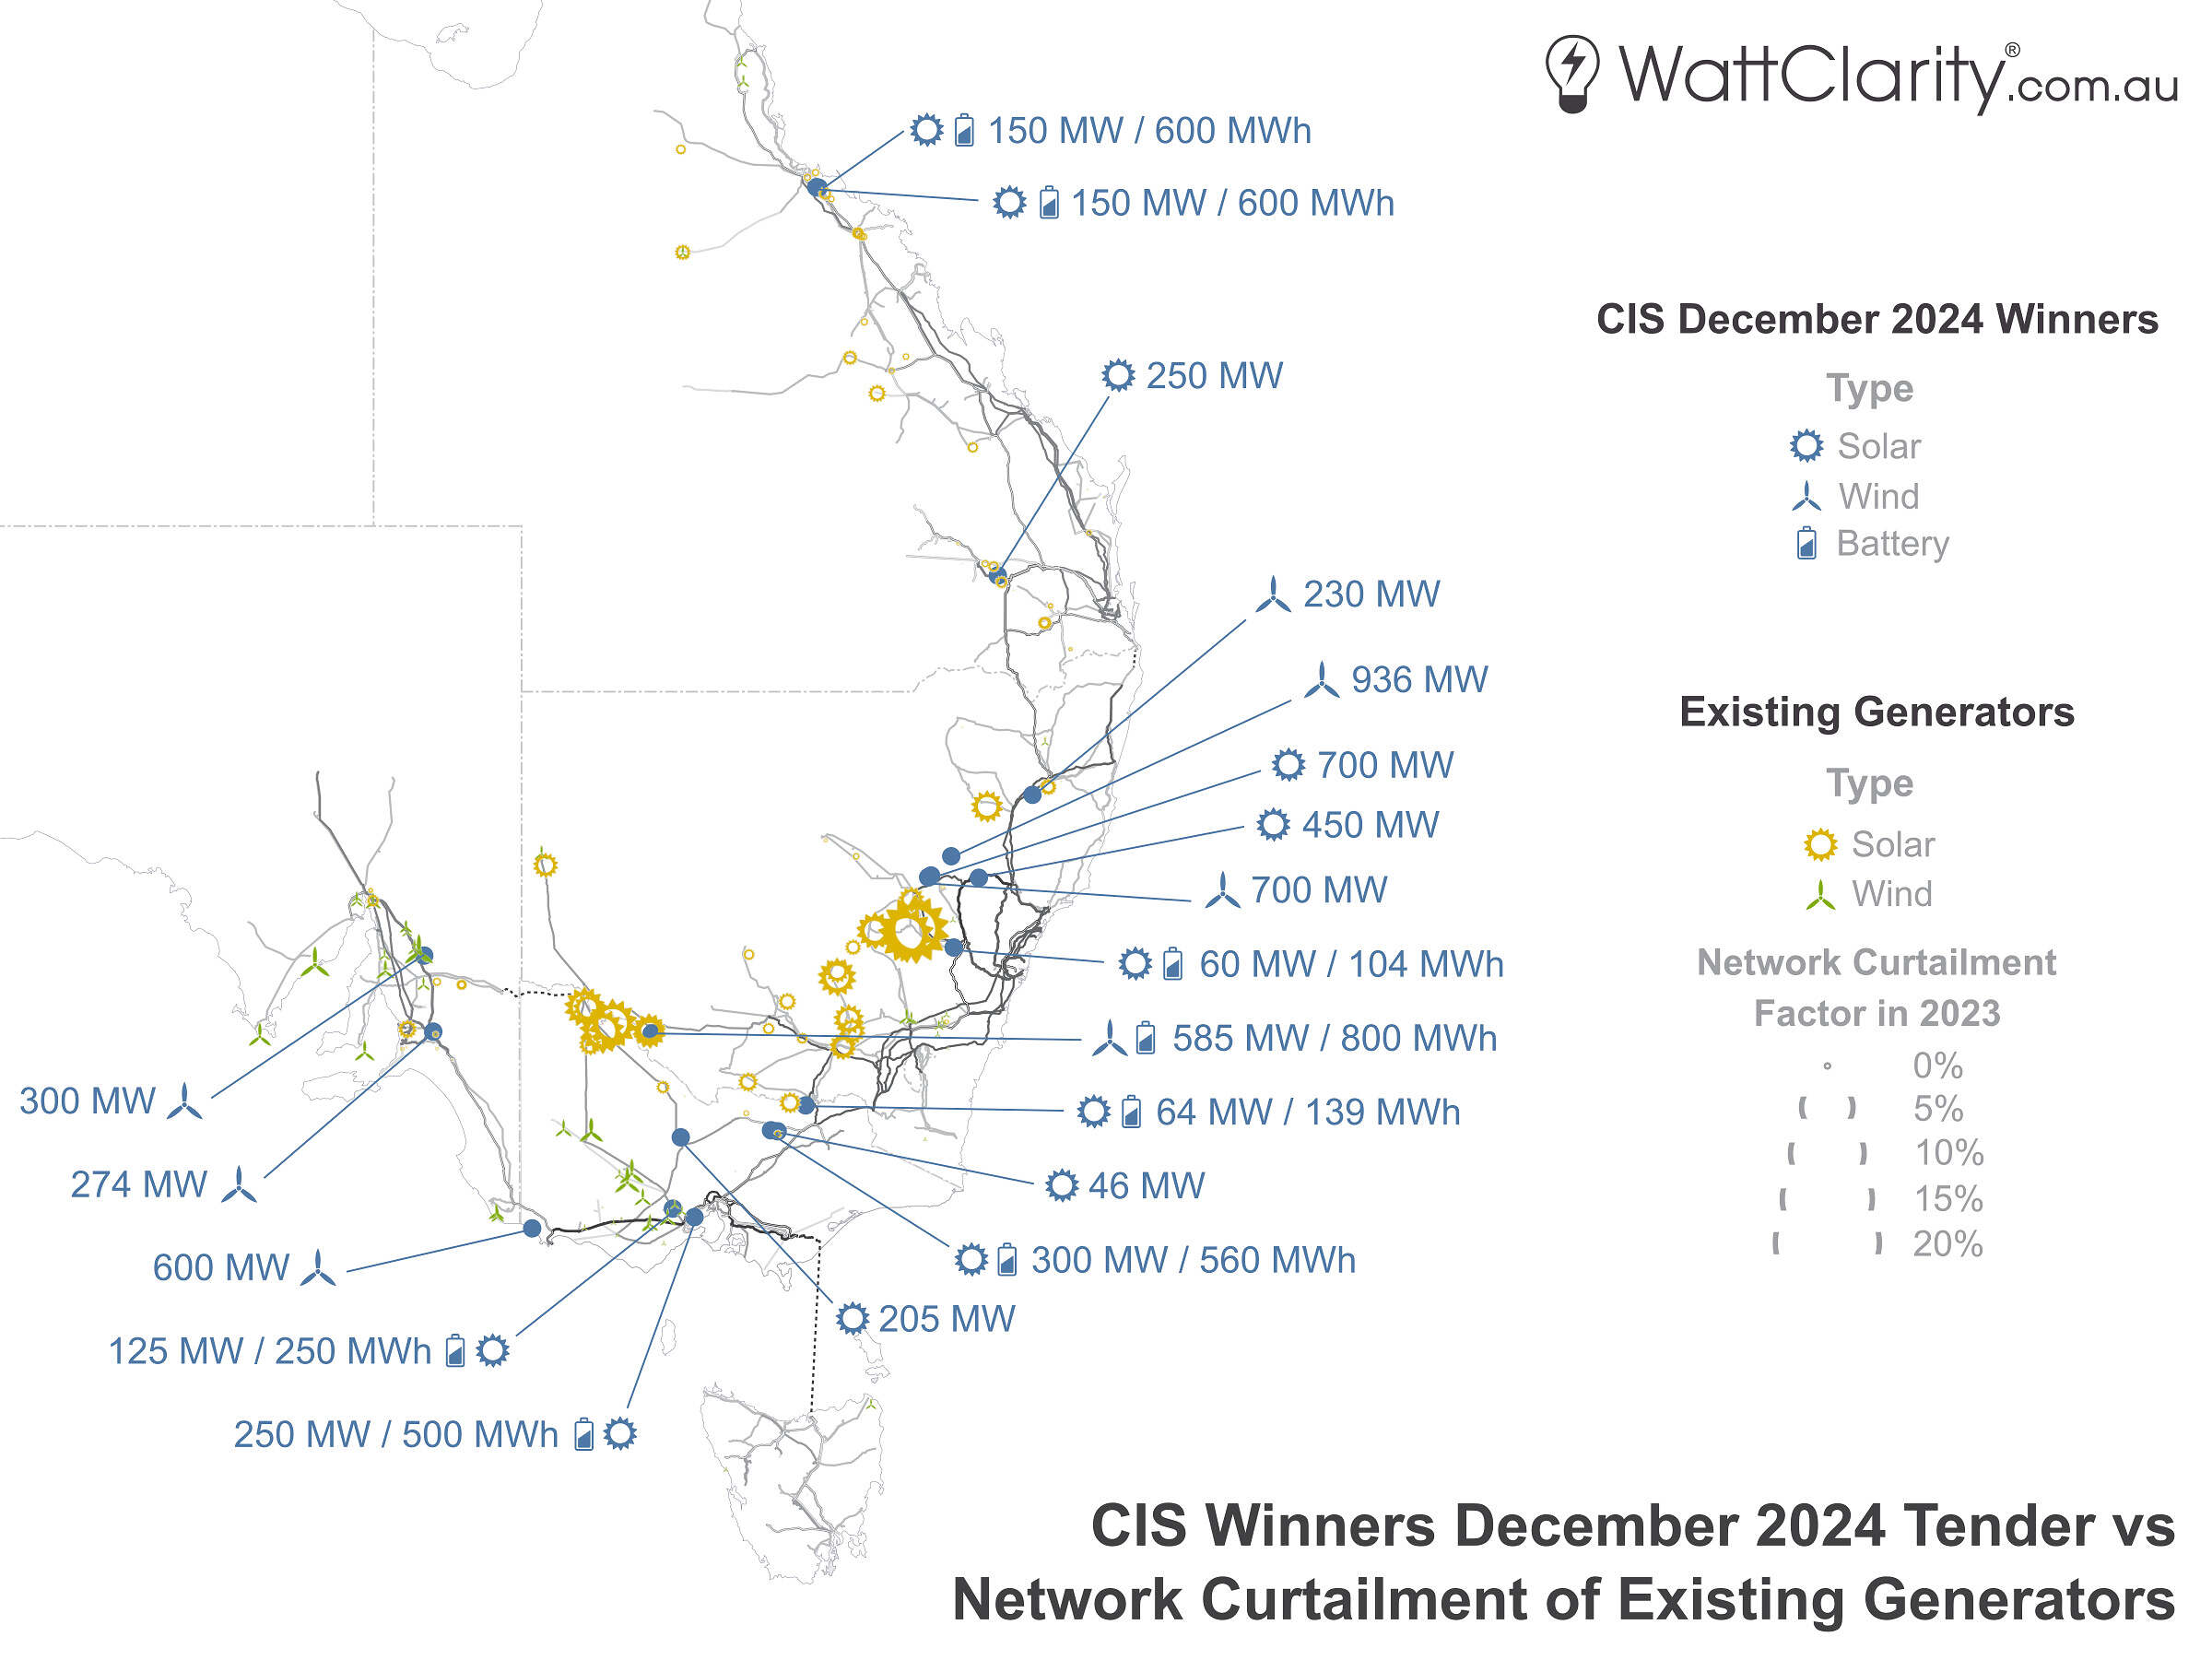
Ben’s request made me curious. So without further ado – below, I’ve taken two maps from an article I wrote about economic and network curtailment back in May, and added the locations of the 19 successful projects from last week’s CIS announcement for comparison.

The locations and fuel types of last week’s CIS winners vs economic curtailment factors in 2023 for existing generation.
Source: GSD2023
Broadly, congestion occurs when parts of the transmission network are overloaded due to a mismatch between supply and demand (specifically, a mismatch between their locational and temporal characteristics).
Curtailment is just one measure of congestion, and for large (semi-scheduled) solar and wind farms we categorise curtailment into two forms:
- Economic Curtailment (a.k.a offloading): a deliberate choice made by a generator to operate below available output. Hence, this type of curtailment is more related to bidding.
- Network Curtailment: a forced outcome where a generator operates below available output due to a network constraint. Hence, this type of curtailment is more related to constraint equations.
Although ‘economic’ curtailment might sound like it has nothing to do with the physical network, it often does because (1) interconnector capacity plays a role in economic curtailment, and (2) bidding behaviour and constraint effects can be intertwined.
The first map above shows the locations of the 19 CIS winning projects in relation to economic curtailment for existing generators. The second map below, shows their locations in relation to network curtailment.

The locations and fuel types of last week’s CIS winners vs network curtailment factors in 2023 for existing generation.
Source: GSD2023
Four of the successful projects (all of which were also amongst the highest in capacity for this CIS round) are located in the to-be-developed Central-West Orana Renewable Energy Zone (REZ) which includes major upgrades to 330kV and 500kV sections of the network near the town of Dubbo, NSW. This REZ is currently anticipated for operation in 2028, although has already faced significant delays.
P.S. In a little over a month, we will publish our GSD2024, which will contain curtailment data and detailed performance metrics for every unit in the NEM over the 2024 calendar year. In the coming weeks, we will post more information and an order form under the Deeper Insights section of our site.


Leave a comment