We noted briefly ‘Afternoon volatility in NSW on Friday 6th December 2024’ as the prices were spiking in NSW.
During and after the price action there were several conversations we noted (internal and external) about what was happening. That fact, plus some underlying curiosity, drove me to open ez2view today and utilise Time-Travel (and the added clarity of ‘next day public’ data) to take a look at what happened:
1) It was pretty quick to use the pre-configured widgets to track down the significant factors;
2) It took considerably more time to put together this explanatory article!
(A) An overview
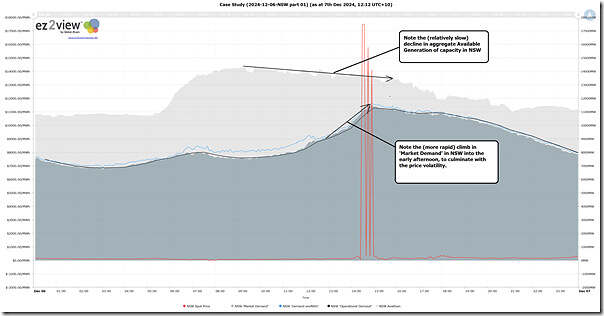
Utilising the ‘Trends Engine’ in ez2view, we start by presenting two basic trends to summarise what actually happened on the day:
For those with a licence to the software, you can open your own copy of the above query here.
In this trend we’ve highlighted both:
1) the gradual decline in Available Generation (of any wholesale supply source, at any price) in the top line
2) the faster ramp in ‘Market Demand’ for the NSW region over 2-3 hours, culminating in the price spike occurring.
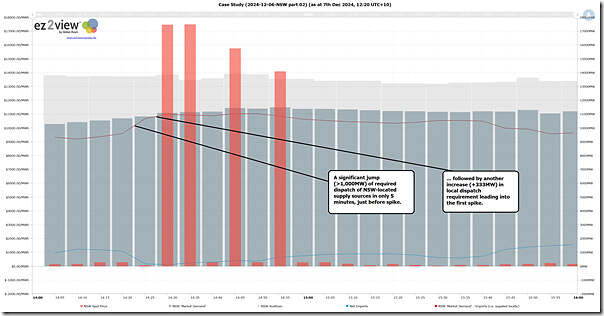
The above does not take into account any capability for imports from VIC or QLD to help support the escalating demand … but the zoomed-in trend chart below does:
For those with a licence to the software, you can open your own copy of the above query here.
It shows that:
1) from 14:20 (at 9,594MW) to 14:30 (at 10,996MW – with the first spike) the required dispatch of local supply options inside of NSW climbed by 1,402MW
2) over the same two periods, the Available Generation in NSW climbed by only 123MW (i.e. 13,737MW to 13,860MW).
… so the supply-demand balance grew considerably tighter.
(B) Specific Dispatch Intervals
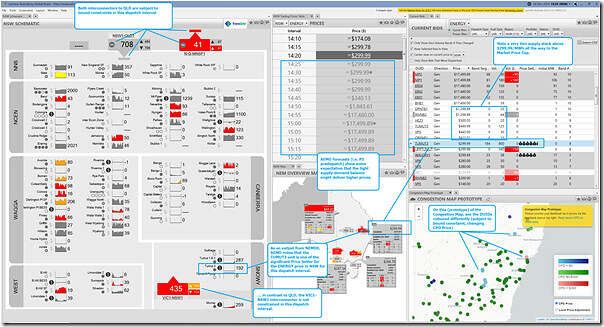
Let’s start at the 14:20 dispatch interval and use a collage of ez2view widgets in Time-Travel, highlighting only some of what’s visible in each of these images (readers should remember to click on any image to view larger resolution image in separate browser tab).
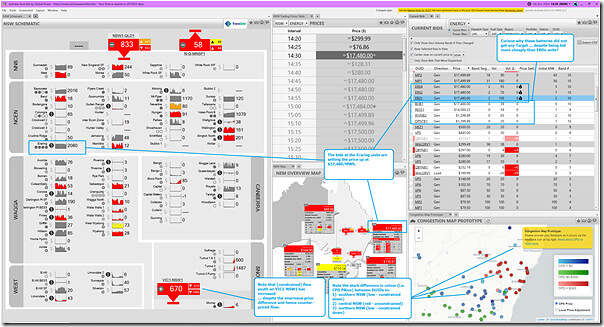
At 14:20 … the NSW price is $299/MWh
We’ve added a number of annotations here to help set the scene for the price spike that will emerge in 2 more dispatch intervals:
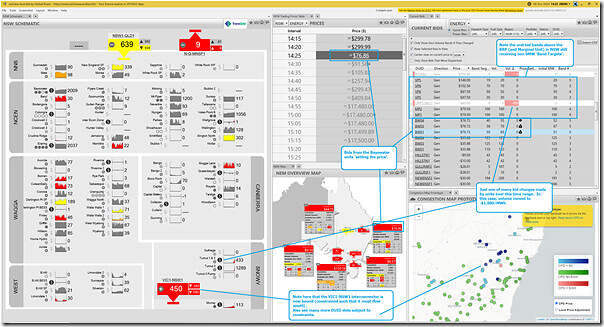
At 14:25 … the NSW price drops, to $76/MWh
Five minutes later, the price has dropped … despite the local requirement for ENERGY dispatch of NSW units has climbing by more than 1,000MW:
Significantly, we now see that the VIC1-NSW1 interconnector is now:
1) Subject to a bound constraint; but also
2) Constrained such that it must flow south (despite the price differential and hence counter-price flow).
Ironic (but hardly a surprise), given we’d posted about ‘The most recent 14 days of data for VIC1-NSW1’ on Friday morning 6th December 2024 …. before the afternoon bout of volatility!
At 14:30 … the NSW price spikes, to $17,480/MWh
This was the first of four dispatch intervals seeing a price spike:
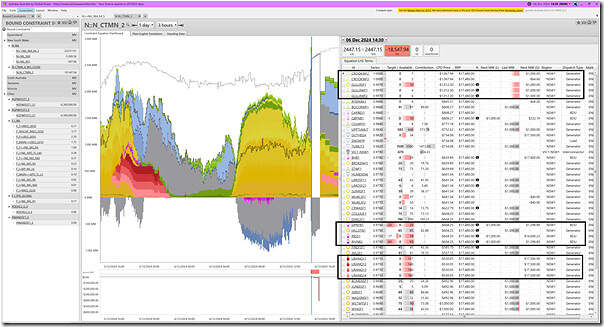
If readers are curious as to why there’s (relatively cheaper) volume apparently available in a few batteries (but which is not dispatched), let’s us the ‘Constraint Dashboard’ widget to take a closer look at the ‘N::N_CTMN_2’ constraint equation:
This is a very rich dashboard allowing many insights to be gleaned … but we’re only going to note here that:
1) The ‘N::N_CTMN_2’ constraint equation (which we have seen before) is part of the ‘N-MNYS_5_WG_CLOSE’ constraint set (which we have also seen before)
2) Amongst the DUIDs on the LHS are the three batteries in question
3) Despite them all offering volume at bid price bands below the RRP, the CPD Price for each unit is (by virtue of constraint impacts) significantly lower than the RRP and, as such, these units are amongst the units that are ‘constrained down’ by the action of this* constraint.
* possibly in conjunction with other constraints (I have not checked).
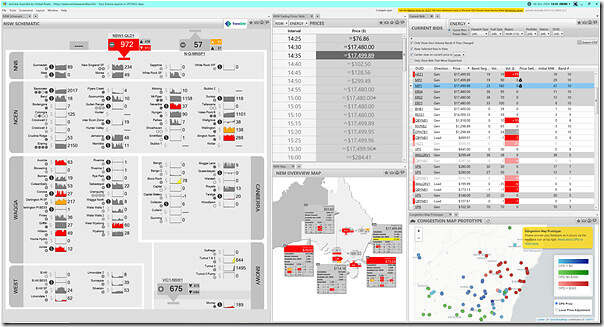
At 14:35 … the NSW price remains high, at $17,499.89/MWh
As the 4th dispatch interval included here, we’ll add 14:30 – but with no annotations:
At 14:40 … the NSW price drops again, to $299.64/MWh
No snapshot here.
At 14:40 … the NSW price rises again, to $15,766.43/MWh
No snapshot here.
At 14:40 … the NSW price drops again, to $299.49/MWh
No snapshot here.
At 14:55 … the NSW price rises again, at $14,101.50/MWh
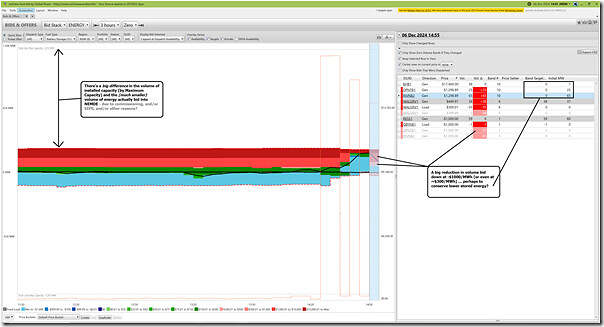
In this case, here’s a snapshot of ‘Bids & Offers’ widget in ez2view zoomed into a narrow window of time and filtered down to show bids just for the NSW battery units:
Note that:
1) For a start, there is much less volume of energy bid into NEMDE across the entire 3-hour time range selected – for reasons not explored at this point, but speculated to be due to a combination of:
(a) Commissioning; and/or
(b) SIPS requirements; and/or
(c) Something else
2) Of the smaller volume of energy bid into NEMDE, at 14:55 we already see some BESS are shifting volume to higher-priced bid bands …
(a) coincident with a drop in aggregate Target; and
(b) perhaps to conserve limited stored energy?
(C) Summarising
So it’s worth summarizing a number of the significant factors* we’ve already identified that, in combination delivered a period of price volatility in an early afternoon period.
* and noting that there may well be other factors not yet identified.
Factor 1 = climbing demand
It’s not a coincidence that the spikes occurred after a period (from ~12:00 to ~15:00) of climbing ‘Market Demand’ – which itself might have been some combination of both:
(a) underlying weather patterns driving Underlying Demand; but also
(b) potentially (and I’ve not yet looked) some reduction in Rooftop PV.
Factor 2 = inter-regional congestion
In this case both QLD and VIC were limited in their ability to support NSW with additional supply options, due to congestion on the interconnectors … creating what we’ve termed before a NSW-only ‘Economic Island’ – which had the effect of exacerbating the tight supply-demand balance.
Factor 3 = a thin supply curve … increasingly clumped at both ends
We’ve written before about the declining volume of energy ‘bid in green’ – as one illustration of how an increasing volume of capacity is clumped at very low and very high prices, with not much in between.
1) We saw in the ‘Current Bids’ widget that this was the case yesterday.
2) This will increasingly lead to:
(a) Boom-bust and high-stakes outcomes for participants on the supply side; and
(b) Increasing volatility for consumers on the demand side of the market … including as it filters through to retail prices.
Factor 4 = constraints are (again) a factor!
In a conversation with a generation participant this week (another generator that is considering coming onboard with ez2view … it’s been a busy 6 months for us), part of the reasoning they outlined was that:
1) Increasingly constraints are playing a central role in how dispatch works and how prices are set
(a) It’s always been possible that this would be the case, it’s just that their sense is that this is happening increasingly often
(b) Whereas perhaps 5-10 years ago, more people were focused on ‘simpler’ economic assessments of bidding behaviour.
2) Aligned with the above is the fact that one of the strengths of ez2view is that:
(a) We’ve already invested $Millions over the years in delivering a range of widgets (such as shown above) to help make constraints more understandable; and
(b) With our investment plan into 2025 and beyond, this investment will be compounded.
In the case of what happened yesterday in NSW, we see above that the ‘N::N_CTMN_2’ constraint equation definitely played a significant role here … along with others not discussed here.
Factor 5 = auto-bidders are far from perfect (and should not be expected to be)
Finally, the example yesterday revealed yet more examples of where auto-bidders did not produce the ‘perfect’ dispatch outcome for a range of plant. No time to go into more details on this weekend day.
Anyone believing that auto-bidders and ‘set and forget’ are all you need for a battery are probably missing the bigger picture.
… this was discussed by James Tetlow recently at All Energy.


Be the first to comment on "Initial Review of price volatility in NSW in early afternoon Friday 6th December 2024"