
Editor’s Note – This is the text of a speech presented by Alex Leemon at All-Energy in Melbourne on Thursday 24th October 2024. Alex’s talk was the second of 4 presentations that Paul noted in his article ‘‘Operating in the NEM’ … from All Energy 2024’.
There are three key revenue streams for large batteries operating in the NEM – spot price arbitrage, and contingency and regulation frequency control ancillary services (FCAS).
It’s typical for a range of other supporting revenue streams to be present in battery projects, however I’m not going to cover these here, largely because of time and the fact that the precise details of these arrangements are typically confidential; but also because the value of these contracts are fundamentally driven by the underlying wholesale market dynamics.
It’s worth noting that wholesale arbitrage and the contingency FCAS markets are also the primary revenue streams for small batteries, however regulation FCAS participation is effectively restricted to the large scheduled batteries.
So what does the revenue stack of a battery look like?
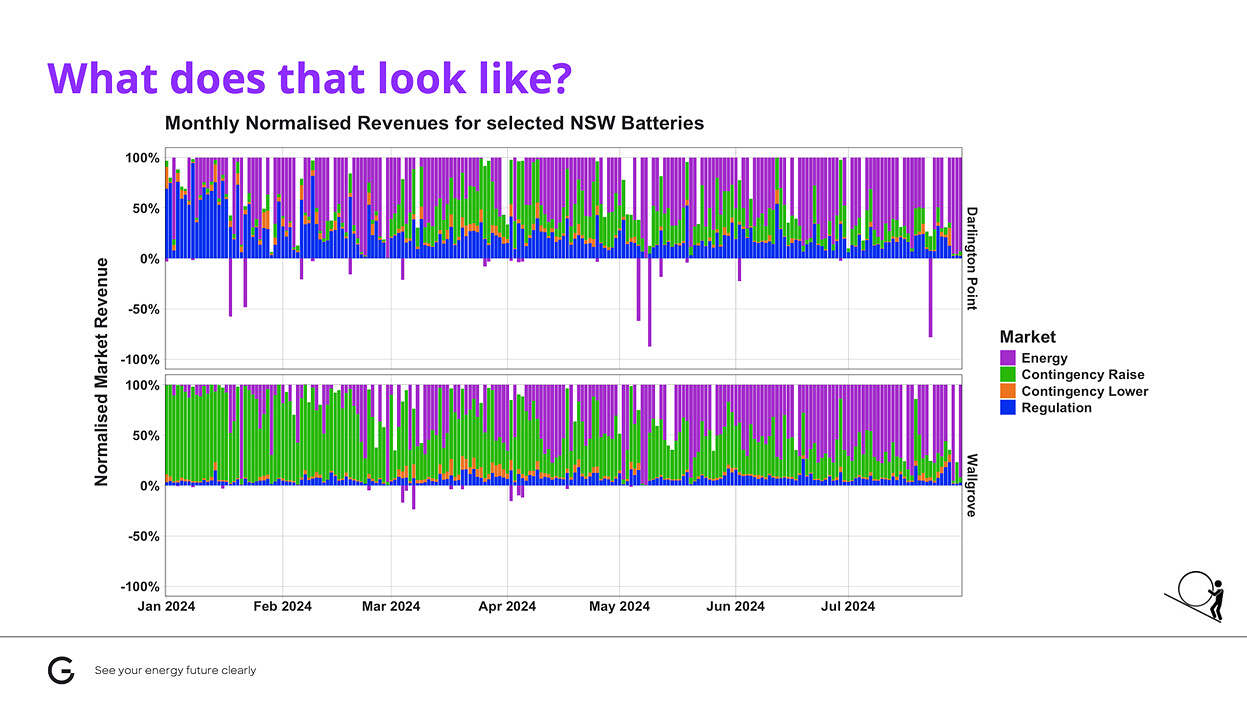
This chart shows the wholesale revenues normalised on a daily basis for the first half of 2024, for two batteries – Darlington Point in the upper panel, and Wallgrove in the lower.
By normalising the revenues on a daily basis we can clearly see the relative contribution of each service to each battery’s revenue stack.
Although both batteries are in New South Wales, and of a roughly similar size, they have very different approaches to wholesale revenues:
- Each battery is operated in quite different ways; for most of 2024 Wallgrove has taken advantage of the very frothy prices of the very fast raise contingency FCAS market (revenue in green), whereas Darlington Point has a much higher proportion of revenue from the regulation FCAS markets (blue).
- A battery’s operating priorities can change on a seasonal or day to day (or even hourly!); taking advantage of shifting market dynamics.
- The lower contingency FCAS markets (revenue in orange), typically, are a very small fraction of revenues; although there have been instances where the lower markets were more valuable.
- Absent very high FCAS pricing, generally 50% or more of a battery’s wholesale revenue (purple), comes from spot price arbitrage.
- Batteries can lose money on given days. There are a range of reasons for this, some more complicated than others, but it’s not guaranteed that batteries end each day in the black.
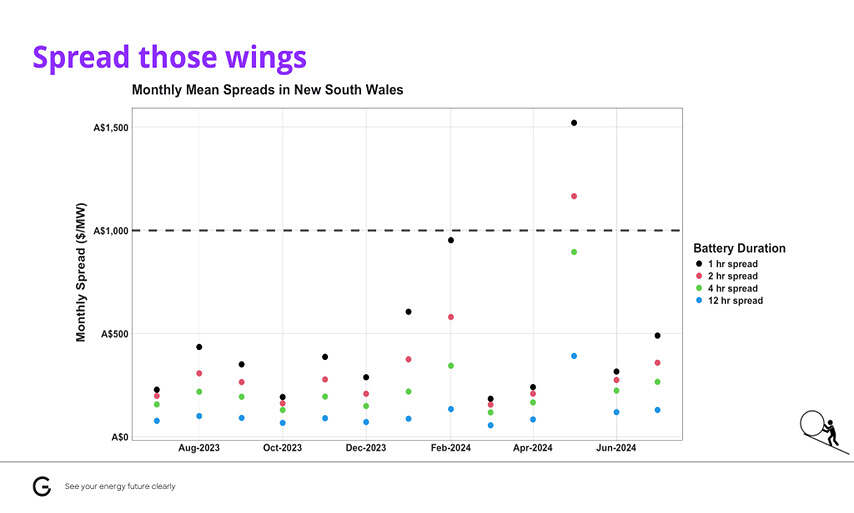
When we talk about arbitrage, the important pricing characteristic is not the average price, and it’s not even necessarily volatility, which we usually define as prices above $300/MWh; it’s the intraday price spread.
The one-hour spread is the difference between the sum of the 12 lowest priced 5-minute intervals, and the 12 most expensive intervals on a given day. The two-hour spread is the difference between the 24 most and 24 least expensive intervals, etc.
The chart above shows the average monthly intraday spreads calculated for several different durations over the last year. The values are normalised per MW of capacity.
Note that the numbers presented here are the absolute revenues available, achieved with full historical knowledge of the market. In reality of course these numbers will be difficult to achieve for a battery operating on imperfect forecasts.
Looking at the chart, it’s pretty clear why the existing crop of large batteries in the NEM are almost exclusively between one and two hours in duration – the intraday spread values significantly decline as duration increases, and longer duration batteries increase in price on a MW basis, making business cases hard to justify.
Battery capex is currently somewhere in the order of $1,000 per MW (marked on the chart with the dotted grey line), it’s clear that even for one and two-hour batteries the economics on wholesale revenues alone are marginal at best; other sources of revenue are needed.
The low wholesale arbitrage value for longer spreads is part of the reason why the Capacity Investment Scheme is so geared towards long-duration batteries.
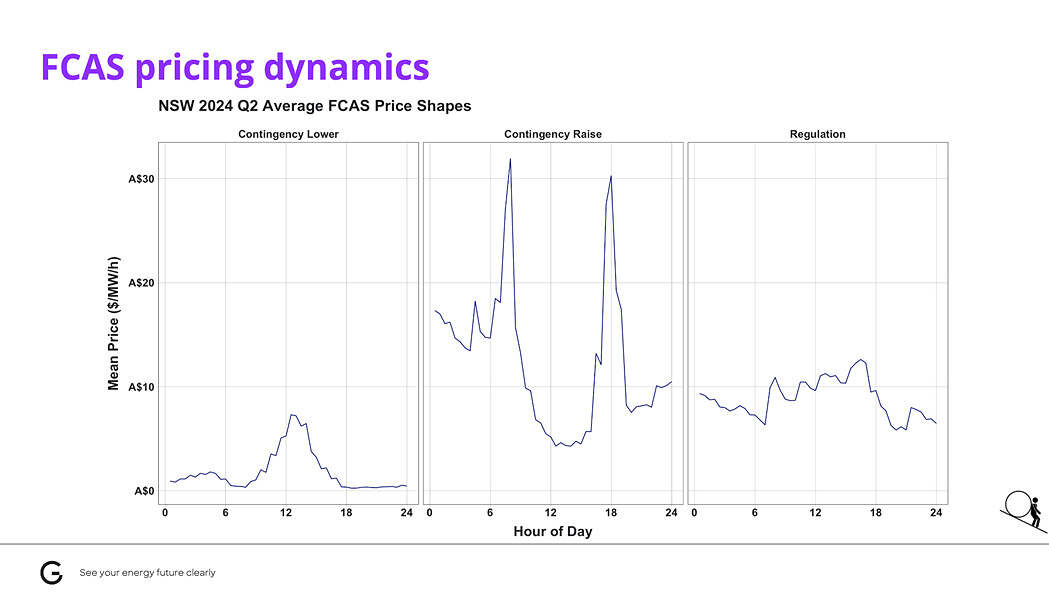
Let’s now talk about FCAS pricing dynamics.
FCAS markets are capacity markets. They are paid in $ per MW per hour for an asset to be available to respond to changes in the system frequency. The price is entirely unrelated to the risk or occurrence of contingency events.
The pricing is instead driven by the supply/demand dynamics of the bidstack – which assets are available to be enabled for FCAS, and how much FCAS is estimated to be required to keep the system stable.
The chart above shows the average FCAS prices across the day in 2024 Q2, aggregated by category.
There’s a few important patterns:
- The contingency lower prices have a clear diurnality to them. When system demand is low in the middle of the day, units are less able to provide these services (by reducing output) – batteries might be offline or charging at full capacity and many thermal units are operating at minimum load.
- The regulation markets also show some diurnality, although to a much lower extent than the contingency lower markets.
- The contingency raise prices have a clear morning and evening peak, when units are busy providing energy to meet system demand peaks.
Although the FCAS markets are capacity markets, it’s worth considering how participation in these markets interacts with the arbitrage mechanics. When a battery is charging or discharging, there is reduced headroom available to earn FCAS revenue.
Because the spot price is typically an order of magnitude more valuable than FCAS, arbitrage will usually take precedence, and we can see this second order effect in the FCAS prices, however there’s clearly a co-optimisation opportunity between the services, particularly during periods of constrained supply
Contingency events, which are typically associated with the loss of a large generator or network element, happen infrequently and last for very short periods of time, up to 10 minutes at most. So for batteries participating in the contingency FCAS markets the energy throughput required to correct the system frequency is immaterial in the grand scheme of things.
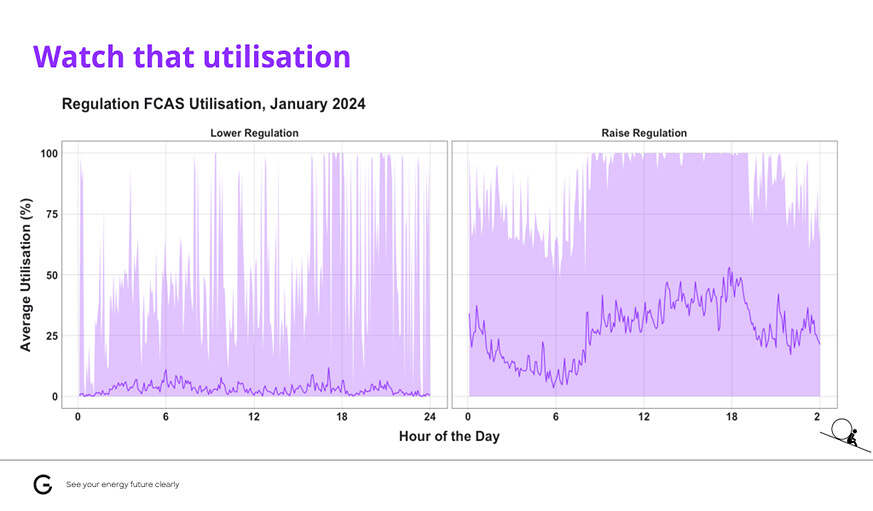
On the other hand, the energy throughput in providing regulation FCAS is very much not immaterial! Units providing regulation FCAS are required to constantly charge or discharge power into the system to correct minor errors in the system frequency.
The charts above show the average energy throughput, plotted as a percentage utilisation of the regulation FCAS procured over the course of the day in January 2024.
The solid line is the average utilisation over the time of day and the shaded area is the maximum utilisation rate experienced in any interval throughout the month.
There is a clear separation between how much energy is utilised in providing lower and raise services, and significant variation over the course of the day. This is particularly true for the raise regulation service, where there is an average throughput approaching 50% in the mid to late afternoon.
And although there is no explicit value associated with the energy used in providing FCAS, any energy sent out or consumed from the grid earns or pays the spot price. Something to think about how that might affect the mechanics of intraday spreads…
In fact, it’s not unreasonable to think that these dynamics might play into advanced considerations of how a battery should be optimised to maximise revenue, especially as the market becomes more contested and participants are increasingly looking for marginal gains.
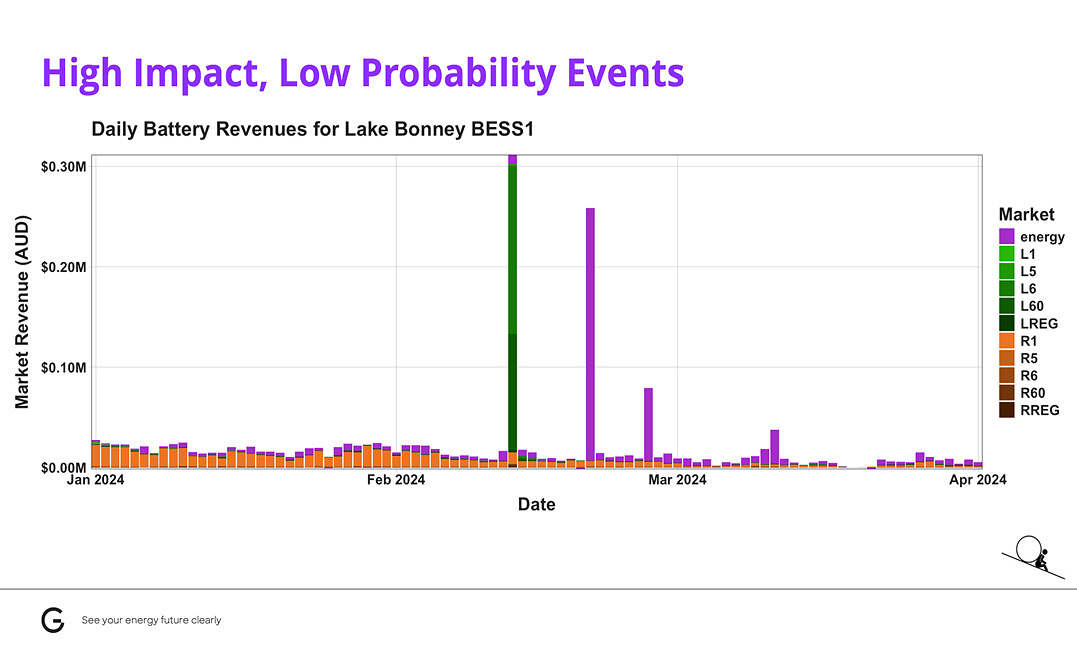
The last thing I’d like to talk about is the idea of high impact, low probability events, or what you might also term tail risk, or even black swan (grey swan?) events.
On the 13th of February this year (the ‘Significant Power System Event‘ covered in many articles collated here) the loss of major transmission lines in western Victoria, led to South Australia becoming electrically islanded, and FCAS could only be provided by units in South Australia. The Fast and Slow Lower Contingency FCAS prices reached the ceiling price of over $16,000 per MW per hour for about an hour, and the Lake Bonney BESS here made more than a year’s worth of lower contingency FCAS revenues in that hour, which we can see as the green spike.
Limited interconnection, hot weather and low wind conditions on the 21st February (noted here) and 27th February (noted here) also drove high volatility in the energy prices, yielding large energy revenues in a short period of time, which are the purple spikes.
It’s worth thinking about how these types of events might be factored into battery revenue expectations. By definition, these events are not forecastable, but we know that historically they occur on at least an annual basis, particularly in regions like South Australia and Queensland (which are more prone to becoming electrically islanded).
The key question is whether a battery will have sufficient state of charge and operational flexibility to respond to these kinds of events.
So what does this all mean? I think there’s two key takeaways for developers looking to build and operate batteries in the NEM.
- A need to understand what’s in the revenue forecasts – how do the forward curves treat high impact low probability events, and are there additional sensitivity analyses and backcasting required to complement the fundamentals. Should these events be factored into the forecast revenues, or should the battery revenues work on the fundamentals alone?
- There’s a clear trade off between different market services – participation in the FCAS markets will impact wholesale arbitrage, particularly the regulation services. Have these interactions been modelled with sufficient fidelity, or has the modelling assumed averages and high level numbers, glossing over the interactions on a 5-minute basis?
Gridcog is modelling software designed for pre-investment analysis of the business case of energy assets, optimising the behaviour at a 5-minute resolution in order to yield long term revenues over the project life. Gridcog can simulate multi-market, multi-asset and multi-participant scenarios.
About our Guest Author
 |
Alex Leemon is the Flexibility Markets Lead at Gridcog and an author at Currently Speaking.
You can find Alex on LinkedIn here. |
Leave a comment