
Late July and early August saw a series of price volatility events across the NEM, most of which received some level of coverage here on WattClarity.
This somewhat speculative post looks at whether “scarcity of supply” or other factors may have driven that volatility. Let’s start with the pattern of events for Q3 2024 to date, summarised via daily average and maximum 5-minute prices by region:
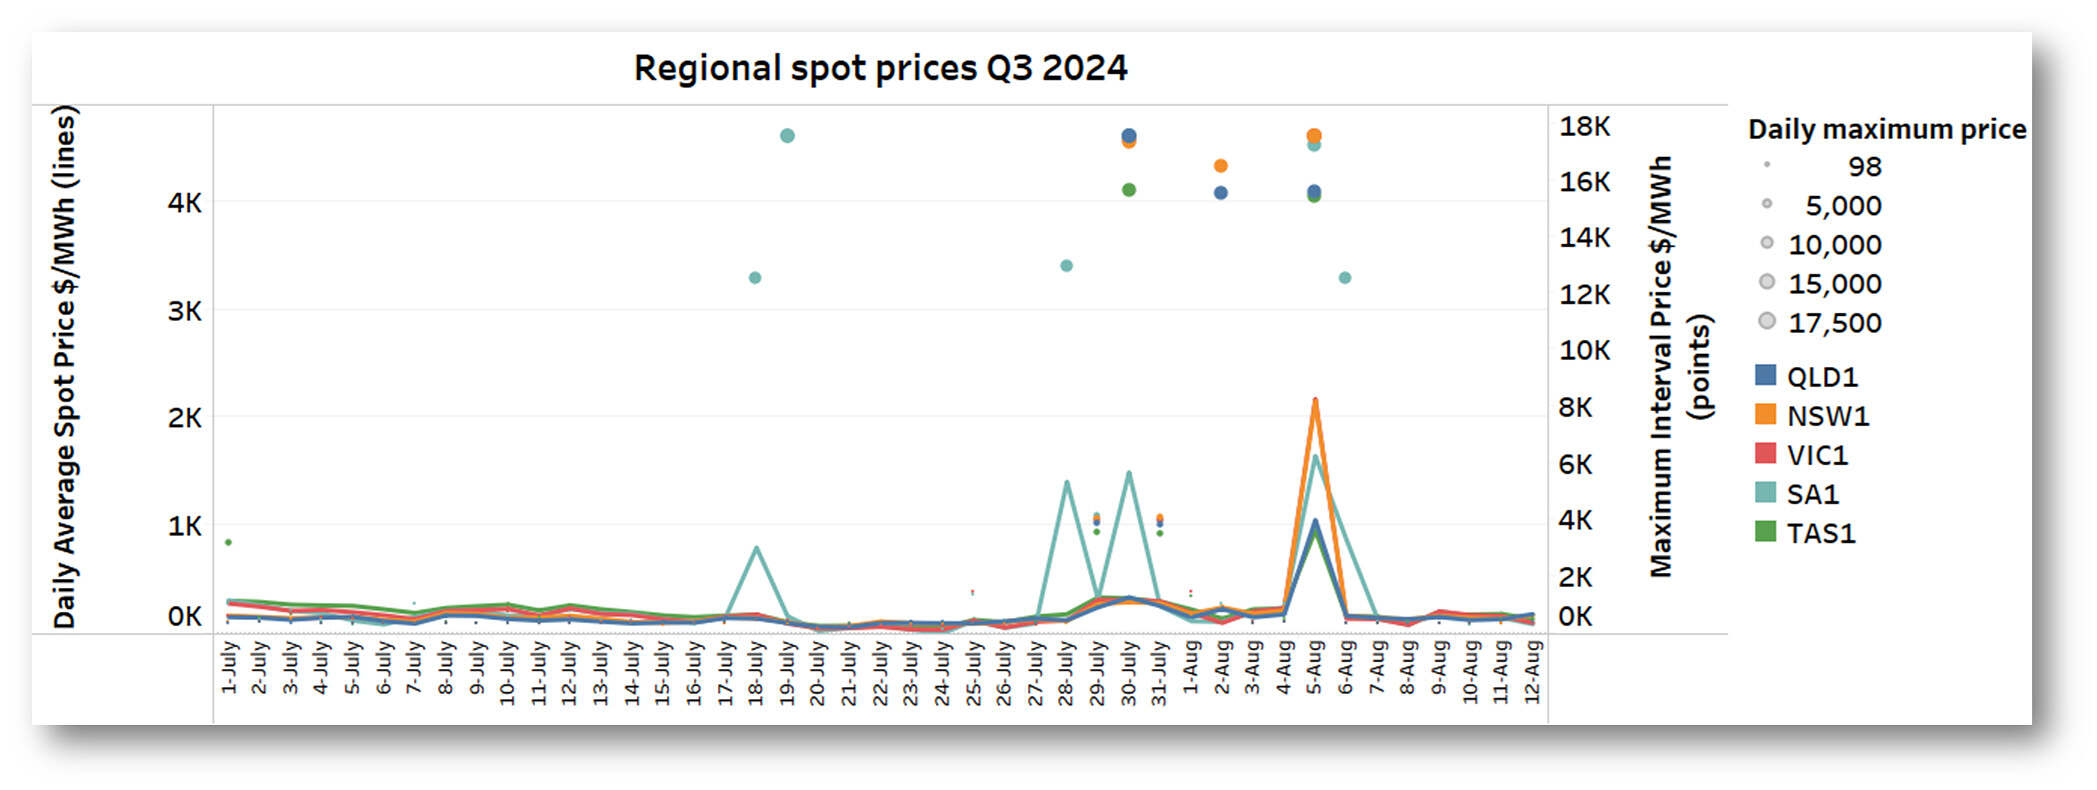
While South Australia experienced the highest volatility, all regions saw days of elevated 5-minute and daily average pricing, concentrated in the period between 28 July and 6 August. The following table summarizes the impact of these price spikes on quarter to date regional averages (up to 12 August):
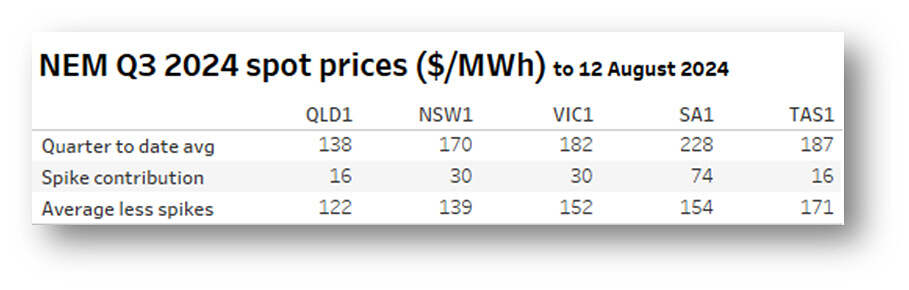
The “spike contribution” here is the difference between the full quarter to date average and the average if we drop out half-hourly periods with average price exceeding $2,000/MWh. This differs from the conventional measure of volatility as price contribution in excess of $300/MWh, to focus more sharply on extreme price events and their impacts.
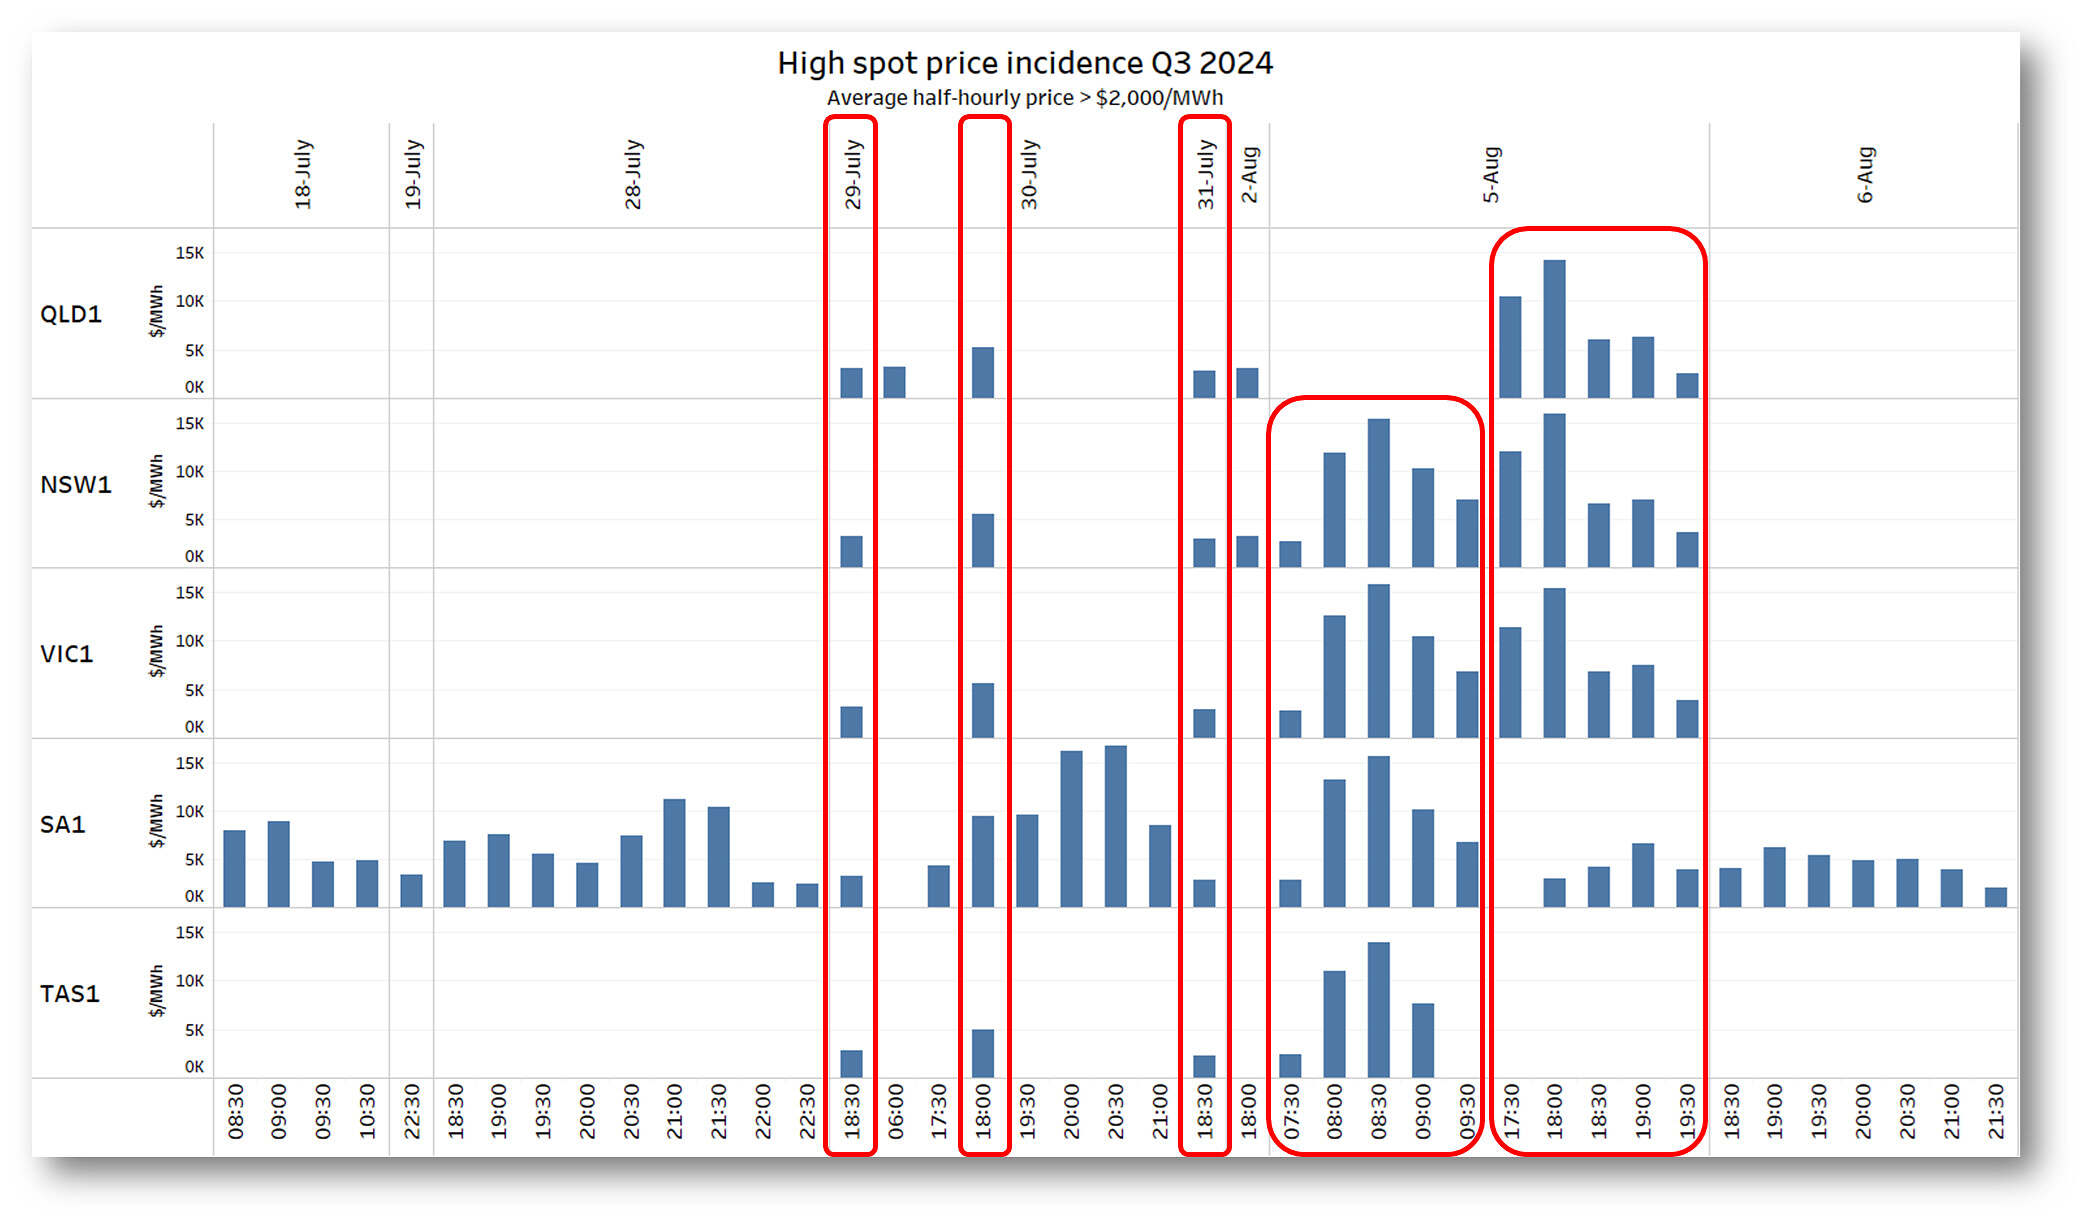
Outside South Australia, most of these events involved only a single half-hourly period containing elevated 5-minute dispatch prices. On Monday 5th August, there was significant NEM-wide volatility covering a couple of hours over both morning and evening peaks. Half-hours of signifiant volatility are summarised in the next chart.
While South Australia saw the most volatility, its causes are often quite specific to that region, typically involving interconnector limitations. In this post I’m going to concentrate more on the geographically wider events highlighted above – these may be more useful for looking at broader drivers of volatility.
Given the morning and evening peak times of day at which these events fell, a first thought might be that tight supply-demand conditions lay behind the volatility. The NEM spot market, in particular its energy-only payment structure and high Market Price Cap (currently $17,500/MWh), is very deliberately designed to allow volatility events at times of supply scarcity. This is intended to provide adequate financial returns for infrequently-used peaking plant and to create investment signals for new dispatchable capacity to mitigate that supply scarcity and maintain system reliability.
Below is the NEM-wide supply mix on 5 August. Solid colour series underneath the dark grey Demand line show aggregate capacity of each source fuel type dispatched to meet demand while their faded counterparts above the Demand line show the remaining available capacity offered to the market but not dispatched. The ratio of this ‘spare’ available capacity to demand is roughly the system’s instantaneous reserve plant margin (IRPM).
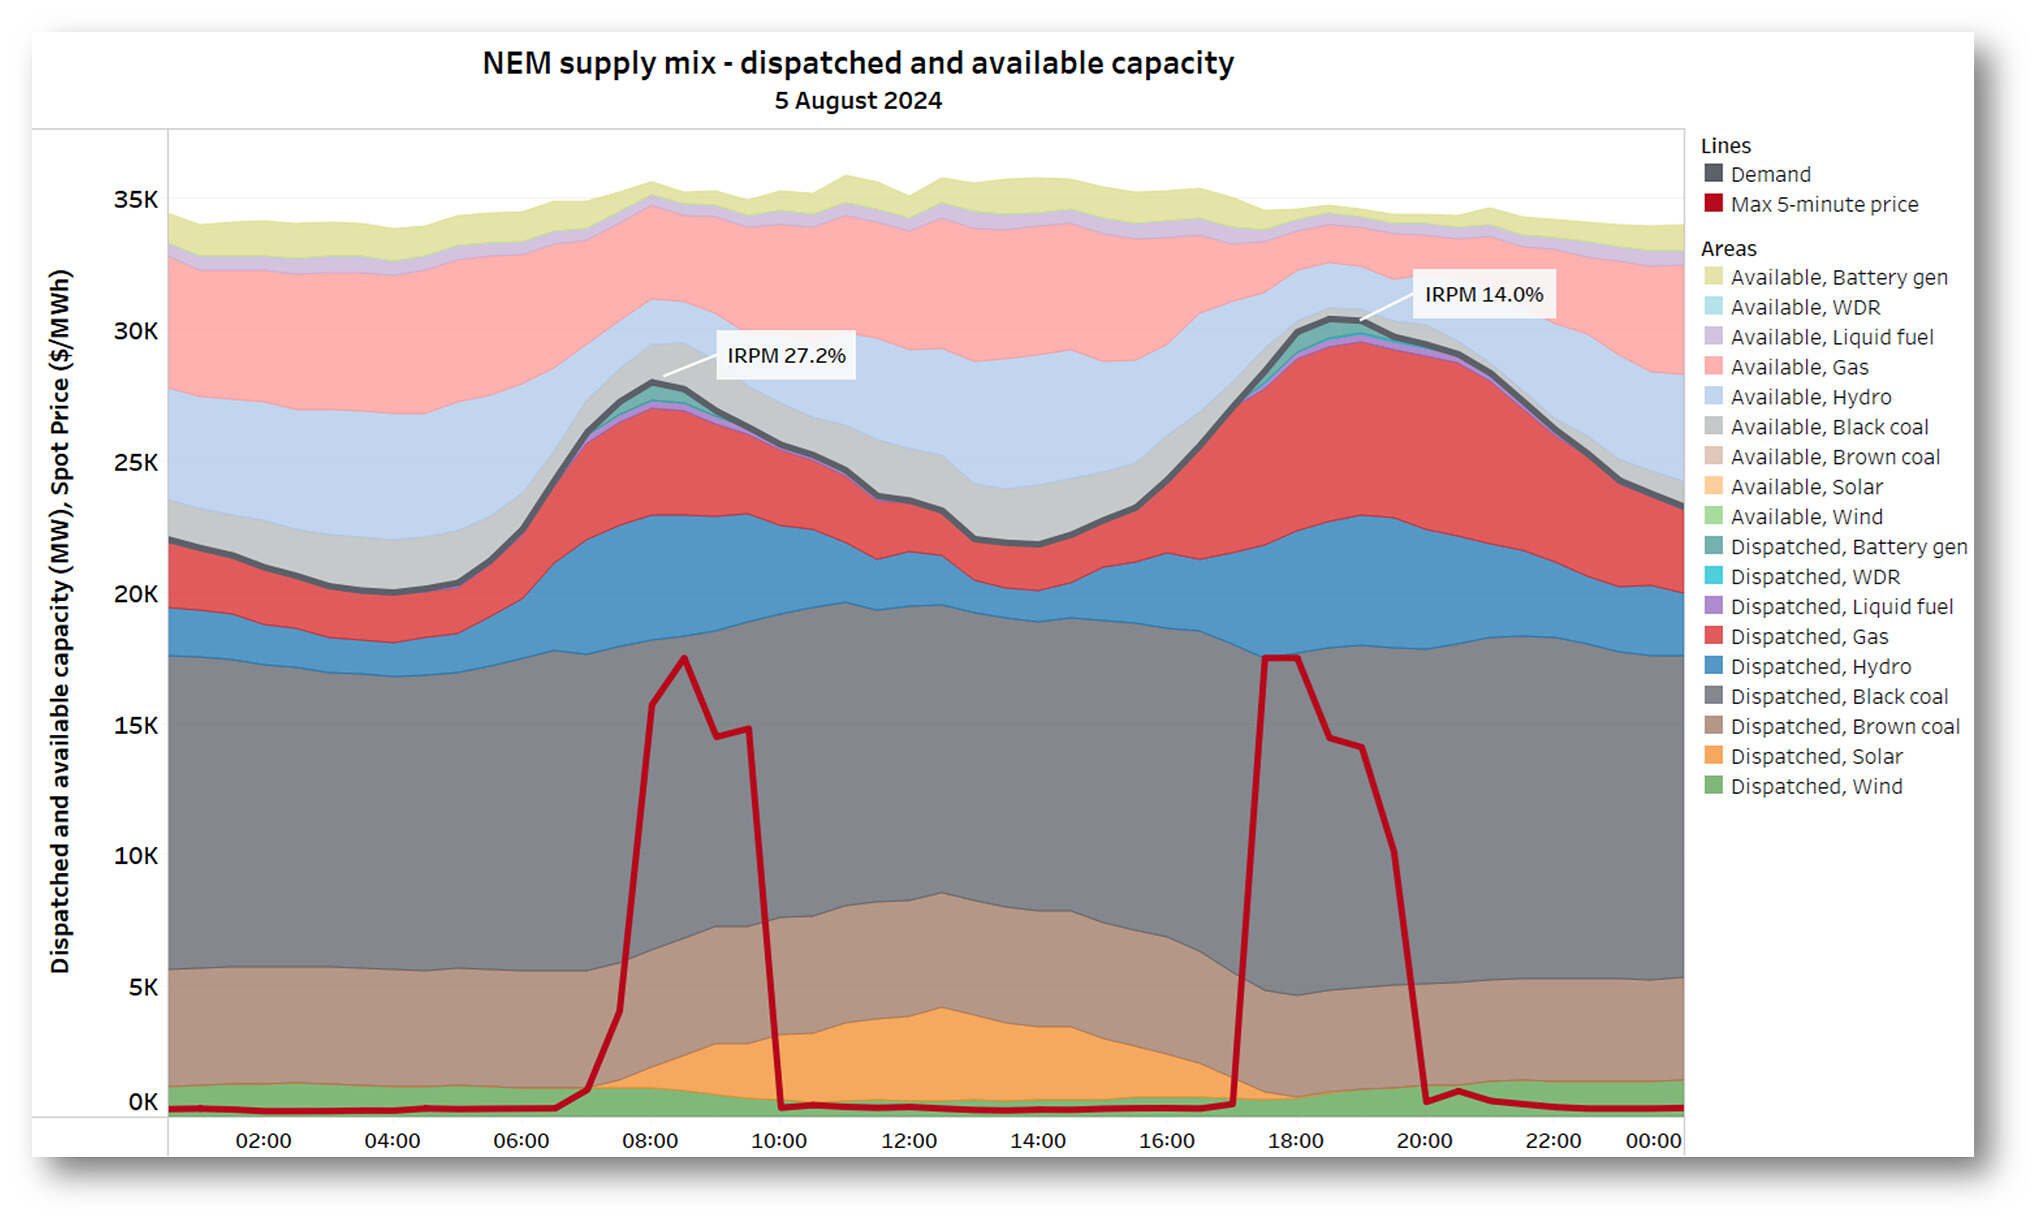
One obvious feature of this day is the low wind contribution, averaging only around 1,000 MW across the NEM, and requiring higher than typical dispatch of more expensive sources like gas. Nevertheless, the system’s reserve margin levels – particularly over the morning peak price period – are nowhere near levels that should give any concerns about system reliability, or signal genuine scarcity of generation.
System planners use reserve margin as a very rough correlate of reliability and like to see levels exceeding 15-20%, but their forward-looking measure would typically be formulated in terms of total installed firm or dispatchable capacity relative to maximum system demand, rather than an “instantaneous” measure. The real-time IRPM in a reliable system may well be lower at times of significant plant outages – since one function of the planning reserve margin is to provide a buffer for such outages.
Looked at another way, despite low renewables contribution during the events illustrated above, there was in excess of 4GW undispatched firm capacity available throughout. The other days of more limited NEM-wide volatility also showed similar patterns of dispatch and levels of undispatched available capacity.
And while I haven’t focussed on South Australia in this post, it was evident in my recent analysis of battery performance over the extended price spike on 30 July that supply scarcity per se was not the key driver of that price outcome.
So these high NEM-wide prices were hardly signalling absolute scarcity of system reserves. What else might have caused them?
Whose watts where?
While there are many possible factors, ownership of generation capacity might be an interesting angle to investigate. Prices spiking in the absence of genuine capacity shortage might be an indication of ownership concentration, particularly of the dispatchable peaking resources that often set prices at times of high net demand.
Here’s a breakdown of the NEM’s dispatchable generation capacity:
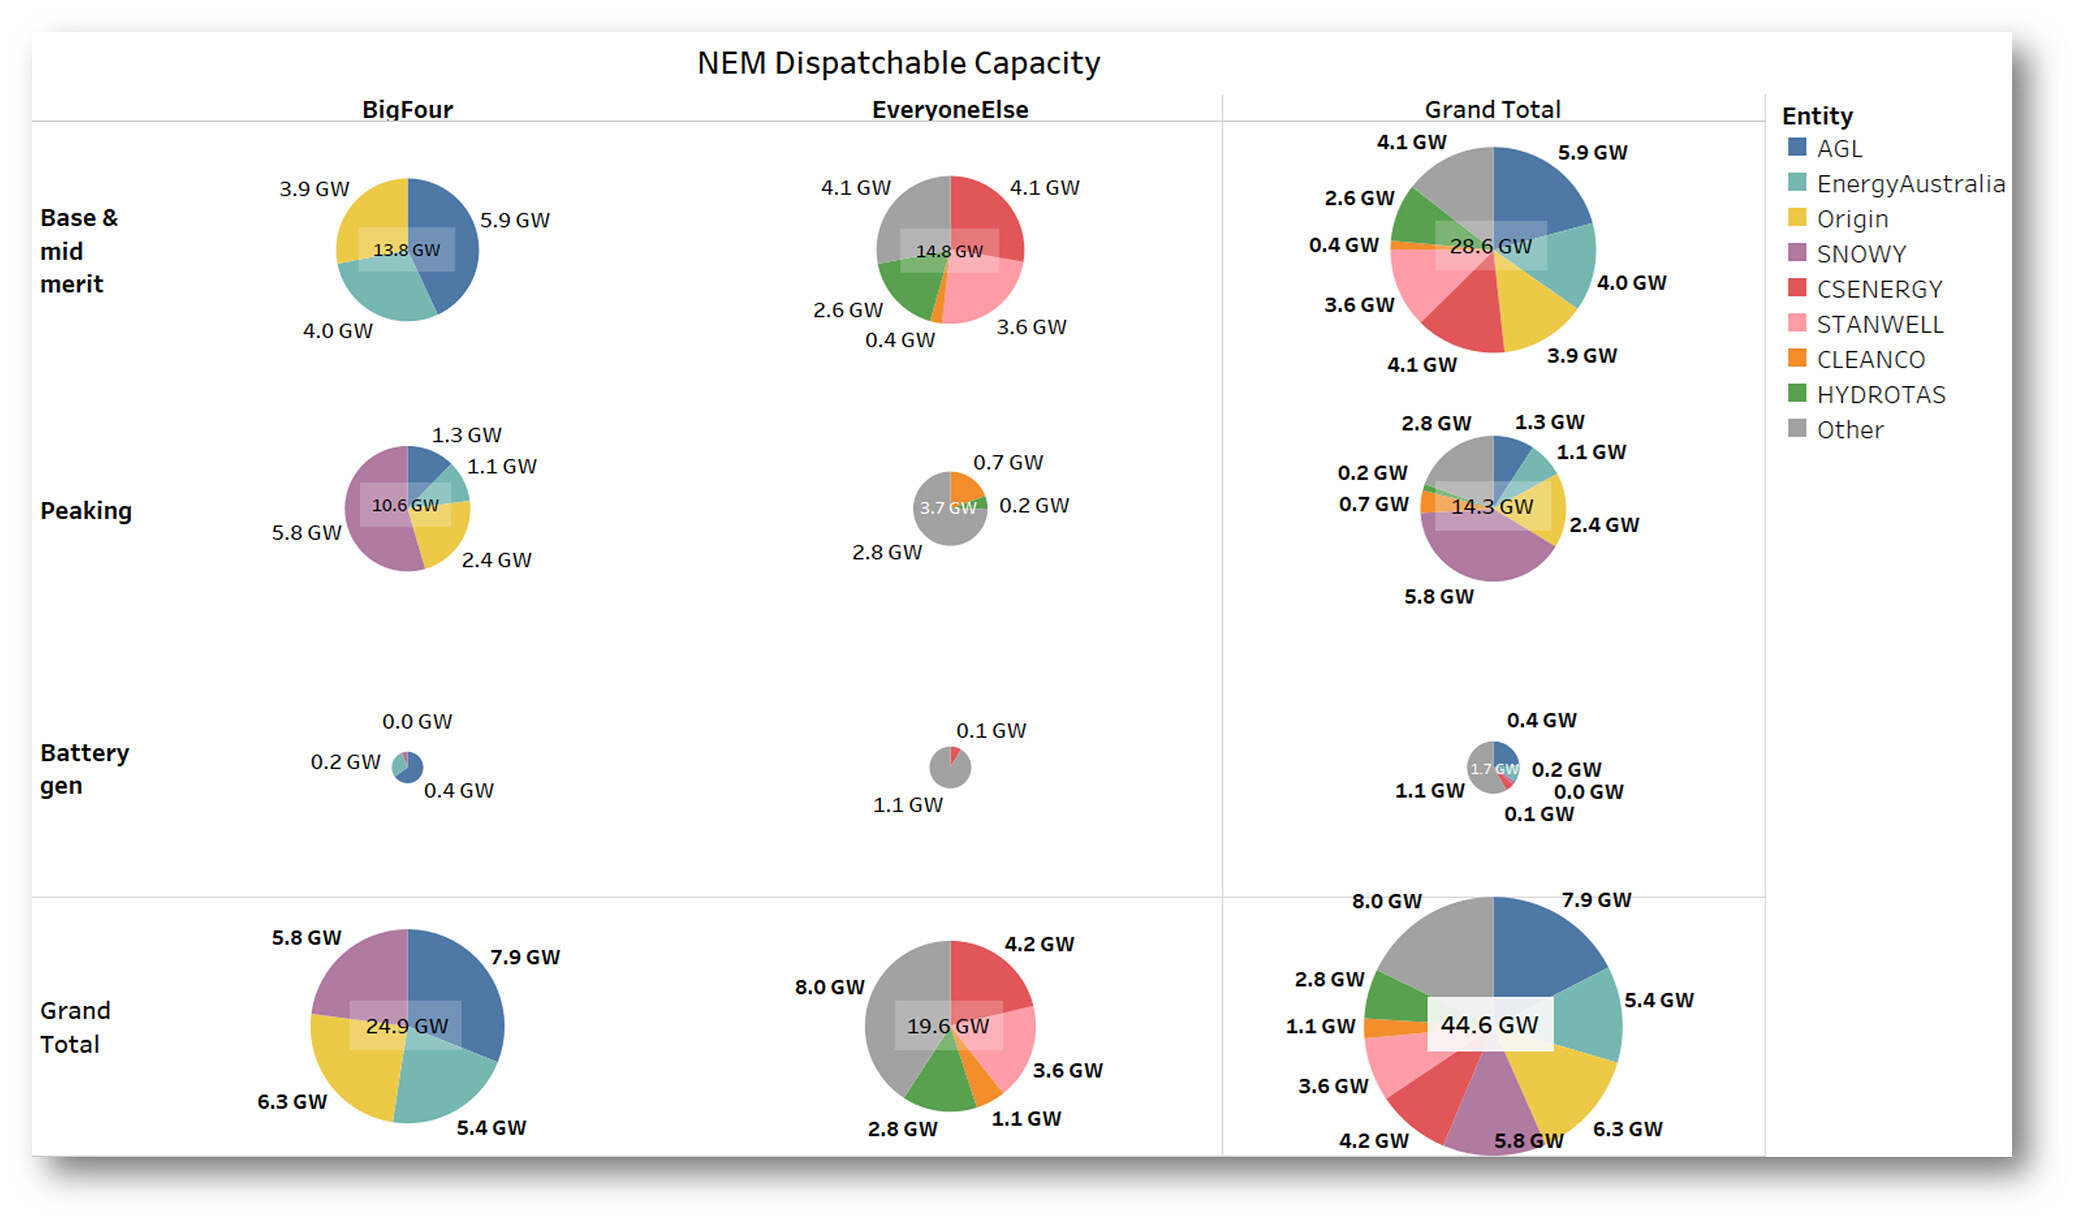
This divides generation owners (or controllers) into two groupings:
- The “Big Four” group who own or control more than half the NEM’s dispatchable capacity, have major assets across multiple regions, and in total control nearly three-quarters of the NEM’s higher cost peaking capacity
- “Everyone else”, comprising
- Four significant government owned and essentially single-region entities who control about 30% of the NEM’s dispatchable capacity – heavily concentrated on lower cost “baseload” and mid-merit generation
- Other owners with much smaller generation footprints
The classification of generation capacity into “Base & mid merit”, “Peaking” capacity, and Battery classes is somewhat arbitrary but intended to capture the different roles and capabilities of the underlying resources. Most gas-fired assets sit in the “Peaking” category, but I’ve put slower-start and combined cycle generators into the Base & mid merit grouping. It might seem odd to also locate Tasmania’s hydro assets in this group while Snowy’s are classified as Peaking, but the nature of Tasmania’s hydro system and its more limited contribution to mainland supply via Basslink make this an arguable distinction.
The fact that the Big Four control more than half the NEM’s dispatchable capacity, and nearly three-quarters of what I’ve labelled as “Peaking”, means that it seems natural to look at how the two broad ownership groupings deployed their assets during recent high price events. We can also check the relative dispatched / undispatched levels of different generation classes at the same time.
Monday 5th August 2024 (morning)
Here’s the morning event on 5 August (which was noted briefly here at the time):
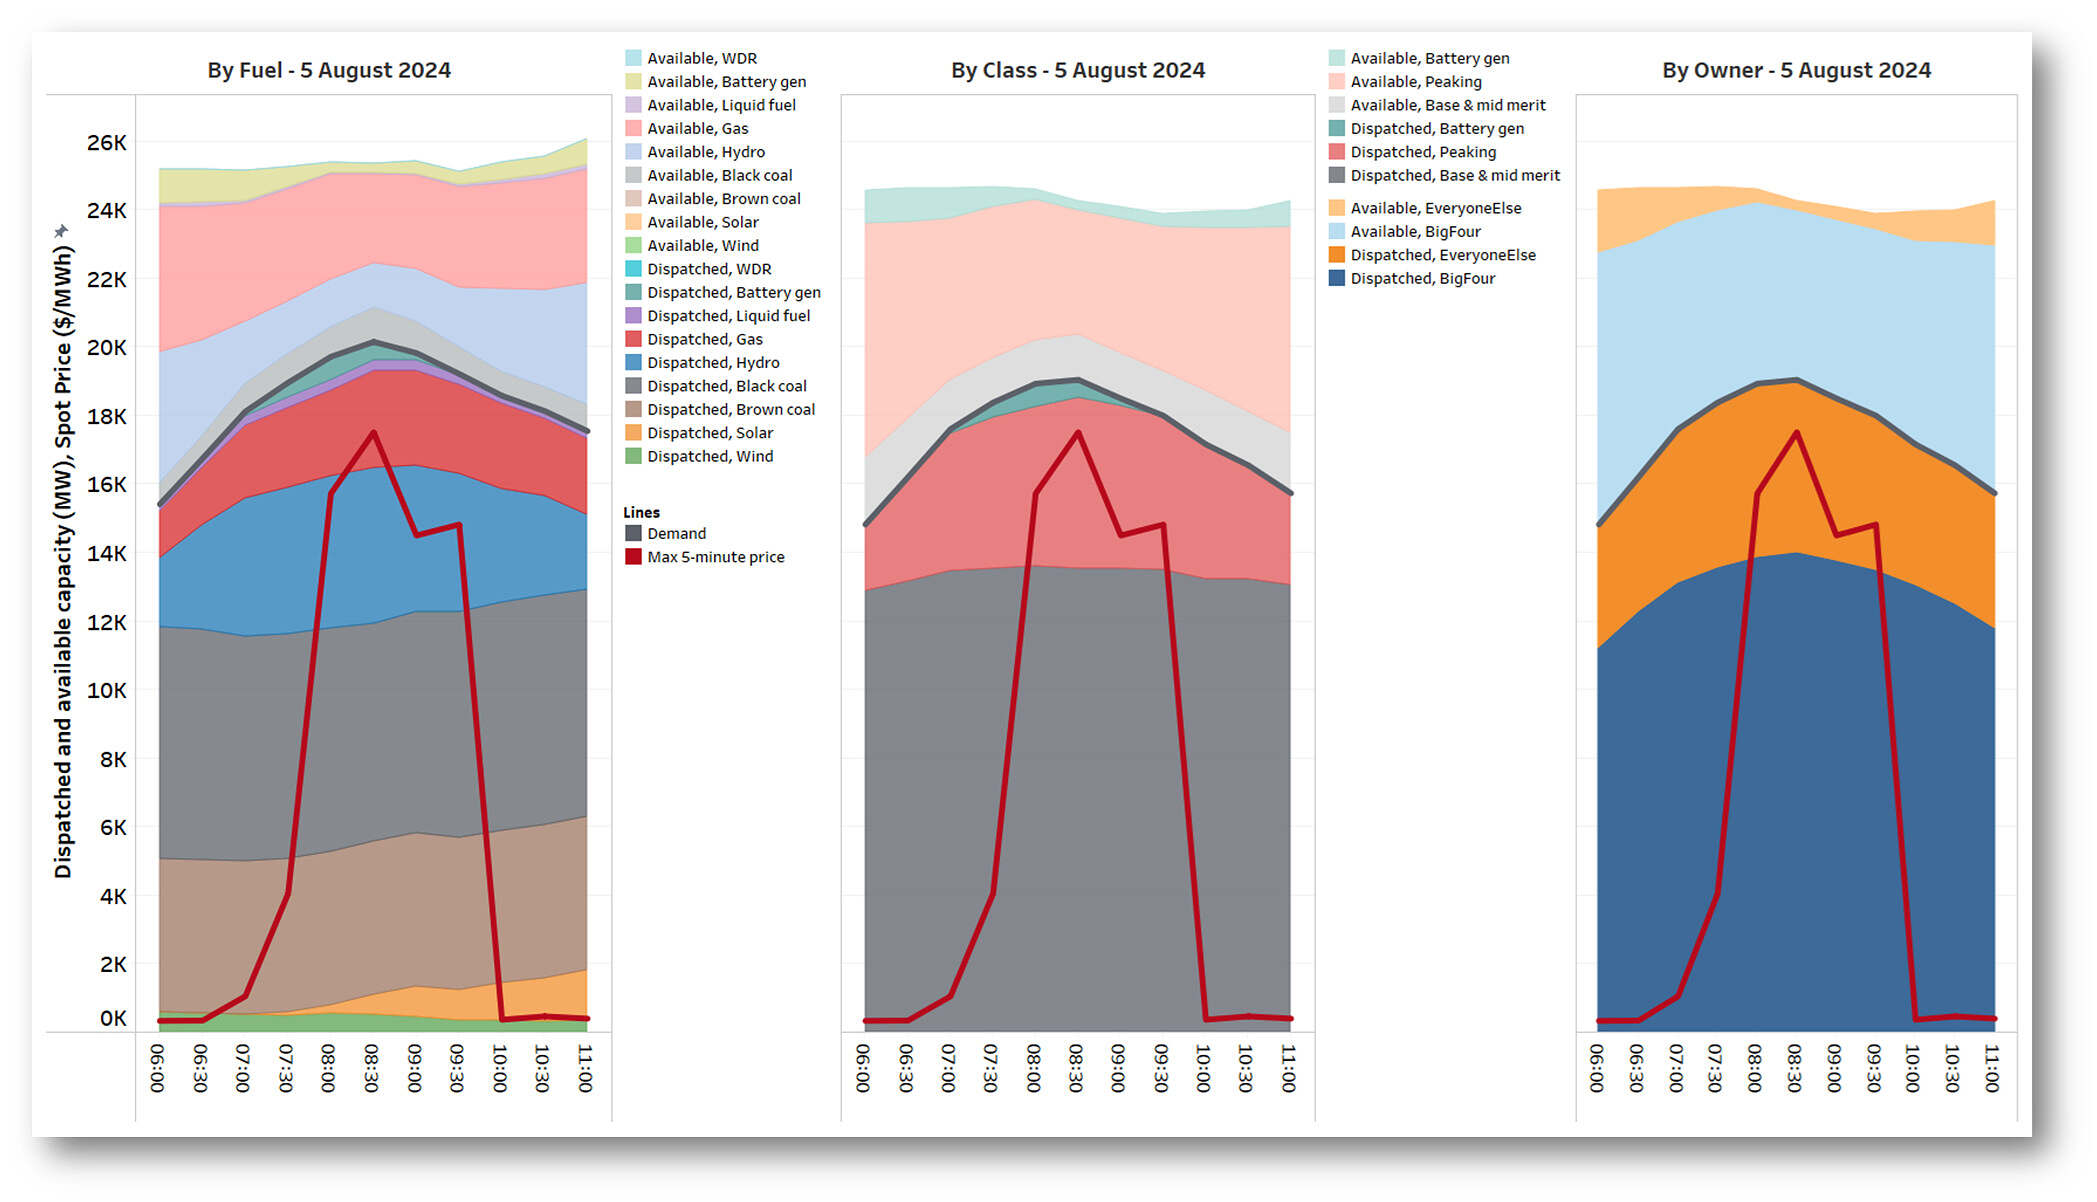
The scope of this view has been narrowed a little by excluding Queensland, since prices didn’t spike there during this event. Also, the “By class” and “By owner” views limit generation to the fully-dispatchable fuel types, since solar and wind contributions were small and fully dispatched in any case.
The middle and right panels make it pretty clear that most of the available but undispatched assets during these price spikes – which remained undispatched due to being offered to the market at very high prices – were:
- (centre panel) as expected, predominantly in the “Peaking” class, although there is also about 1.3 GW of undispatched Base & mid-merit plant through the event;
- (right-hand panel) perhaps unexpectedly (?), almost entirely owned by the Big Four generators, with only a very small slice of undispatched generation owned by others. Here it is worth noting that with Queensland excluded, the Big Four’s share of installed peaking capacity rises to nearly 88%, with Snowy Hydro alone controlling more than 50%.
Monday 5th August 2024 (evening)
Below is the corresponding view for the evening event on 5 August:
- Which was noted briefly here at the time
- In this case, Queensland saw high prices and has been included, while Tasmania misses out:
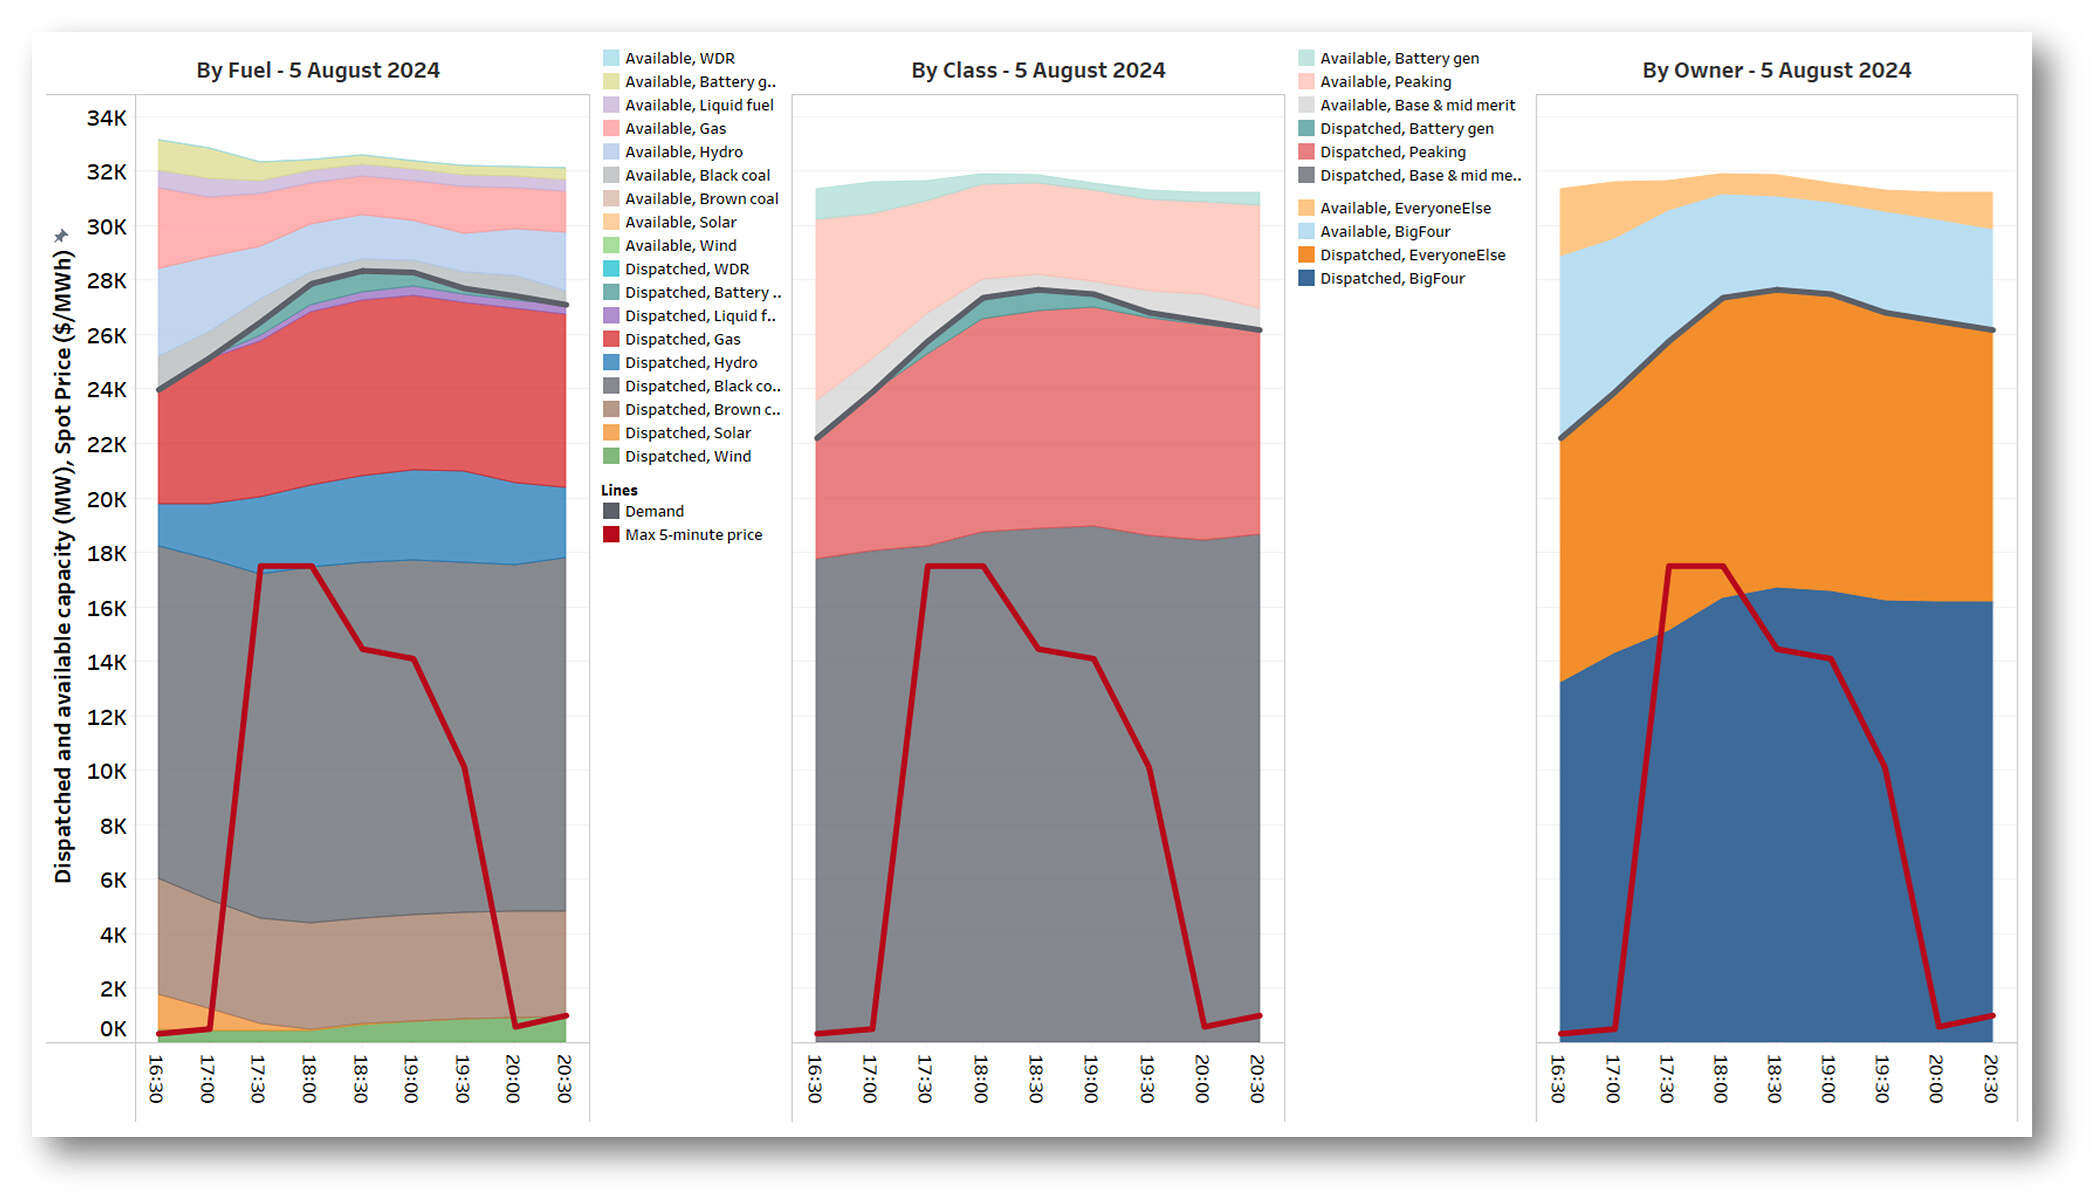
These show similar relativities in dispatched and undispatched capacity, albeit with a slightly higher proportion of the undispatched capacity being non-Big Four.
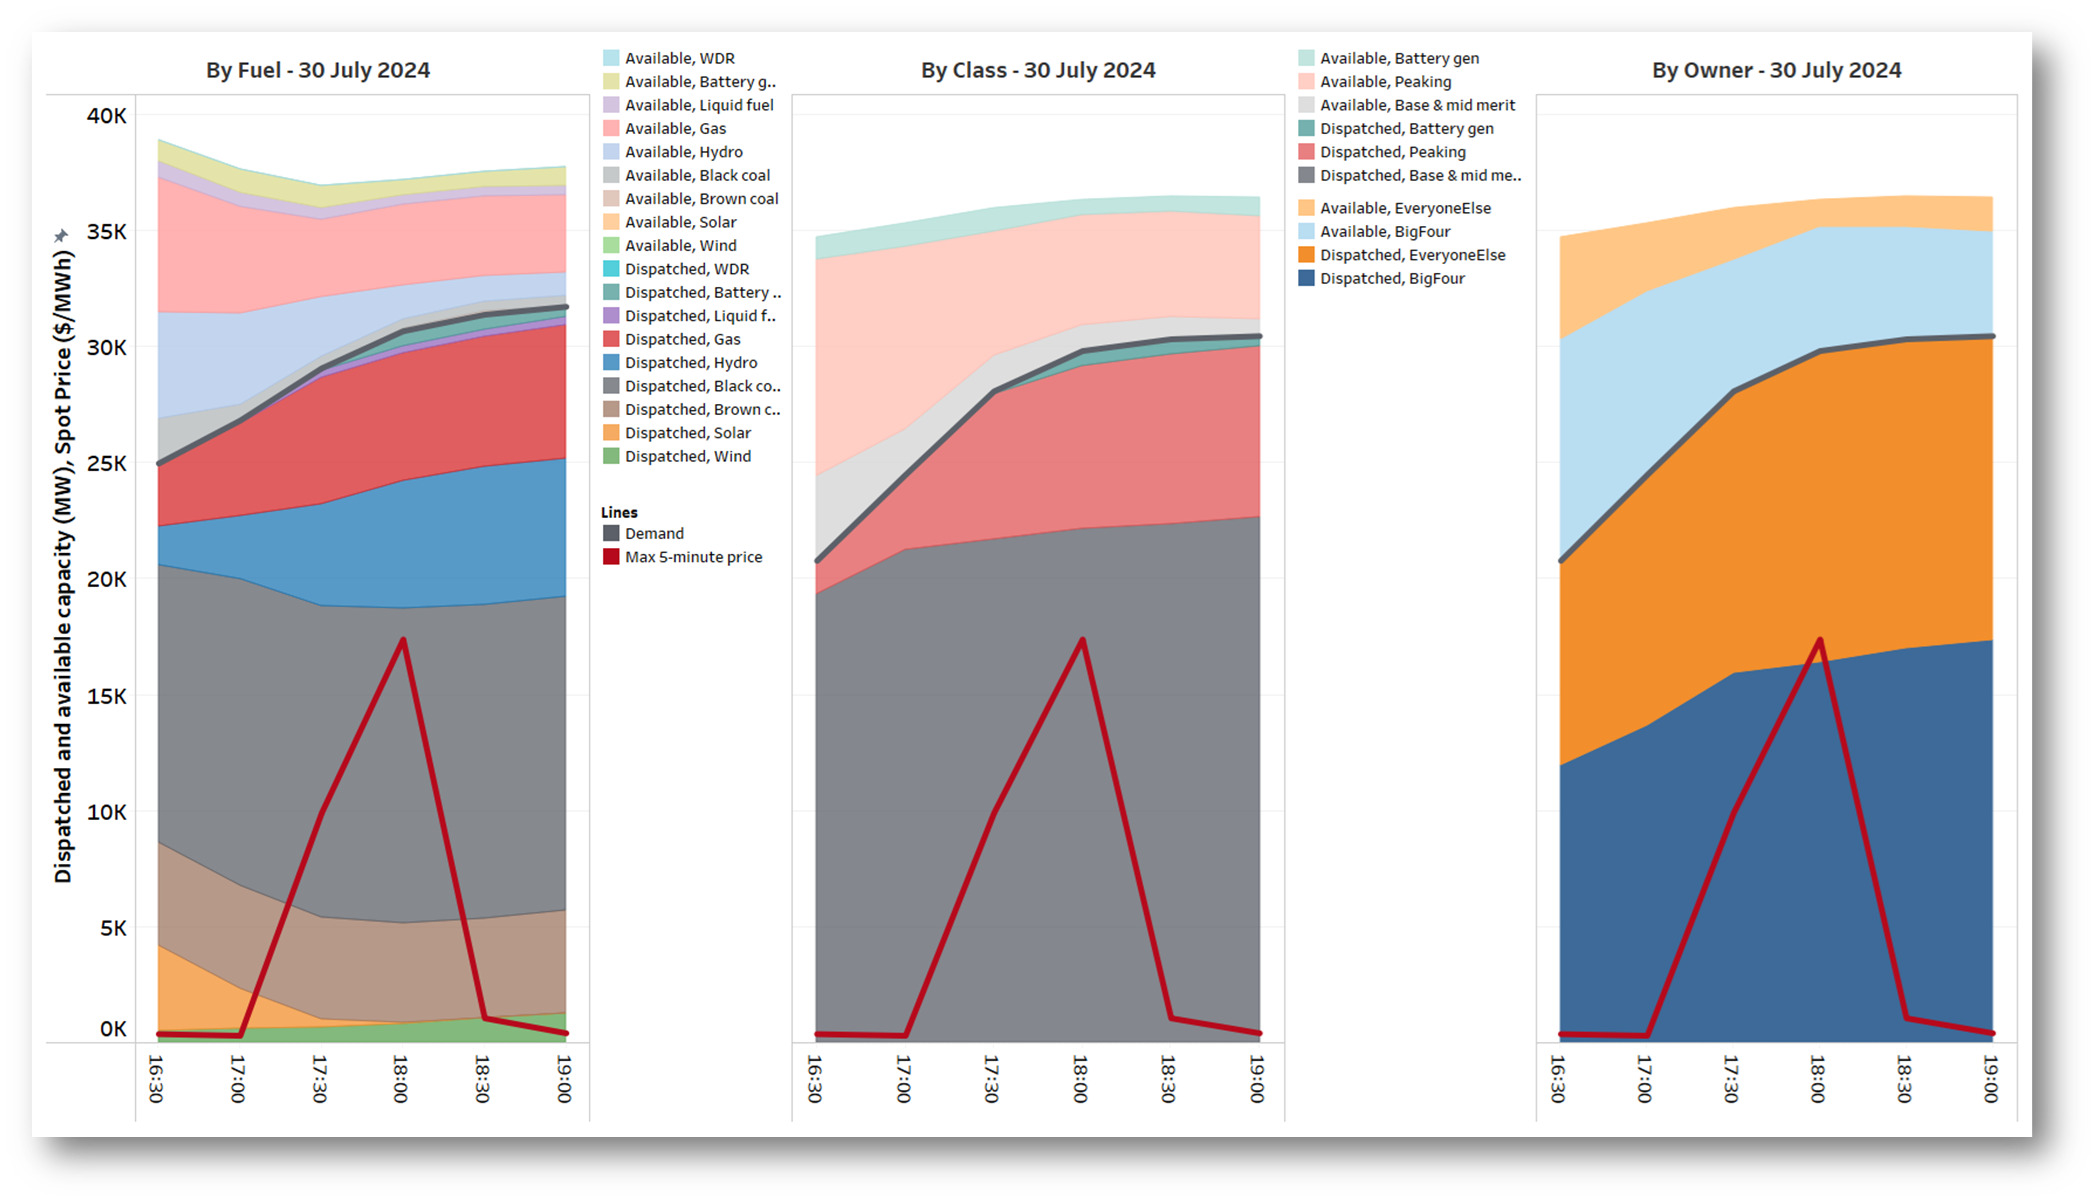
Tuesday 30th July 2024 (evening)
Picking the shorter events on a couple of other days, on the evening of 30 July (already discussed in some articles here) we see:
Wednesday 31st July 2024 (evening)
And on Wednesday 31 July (already discussed in some articles here):
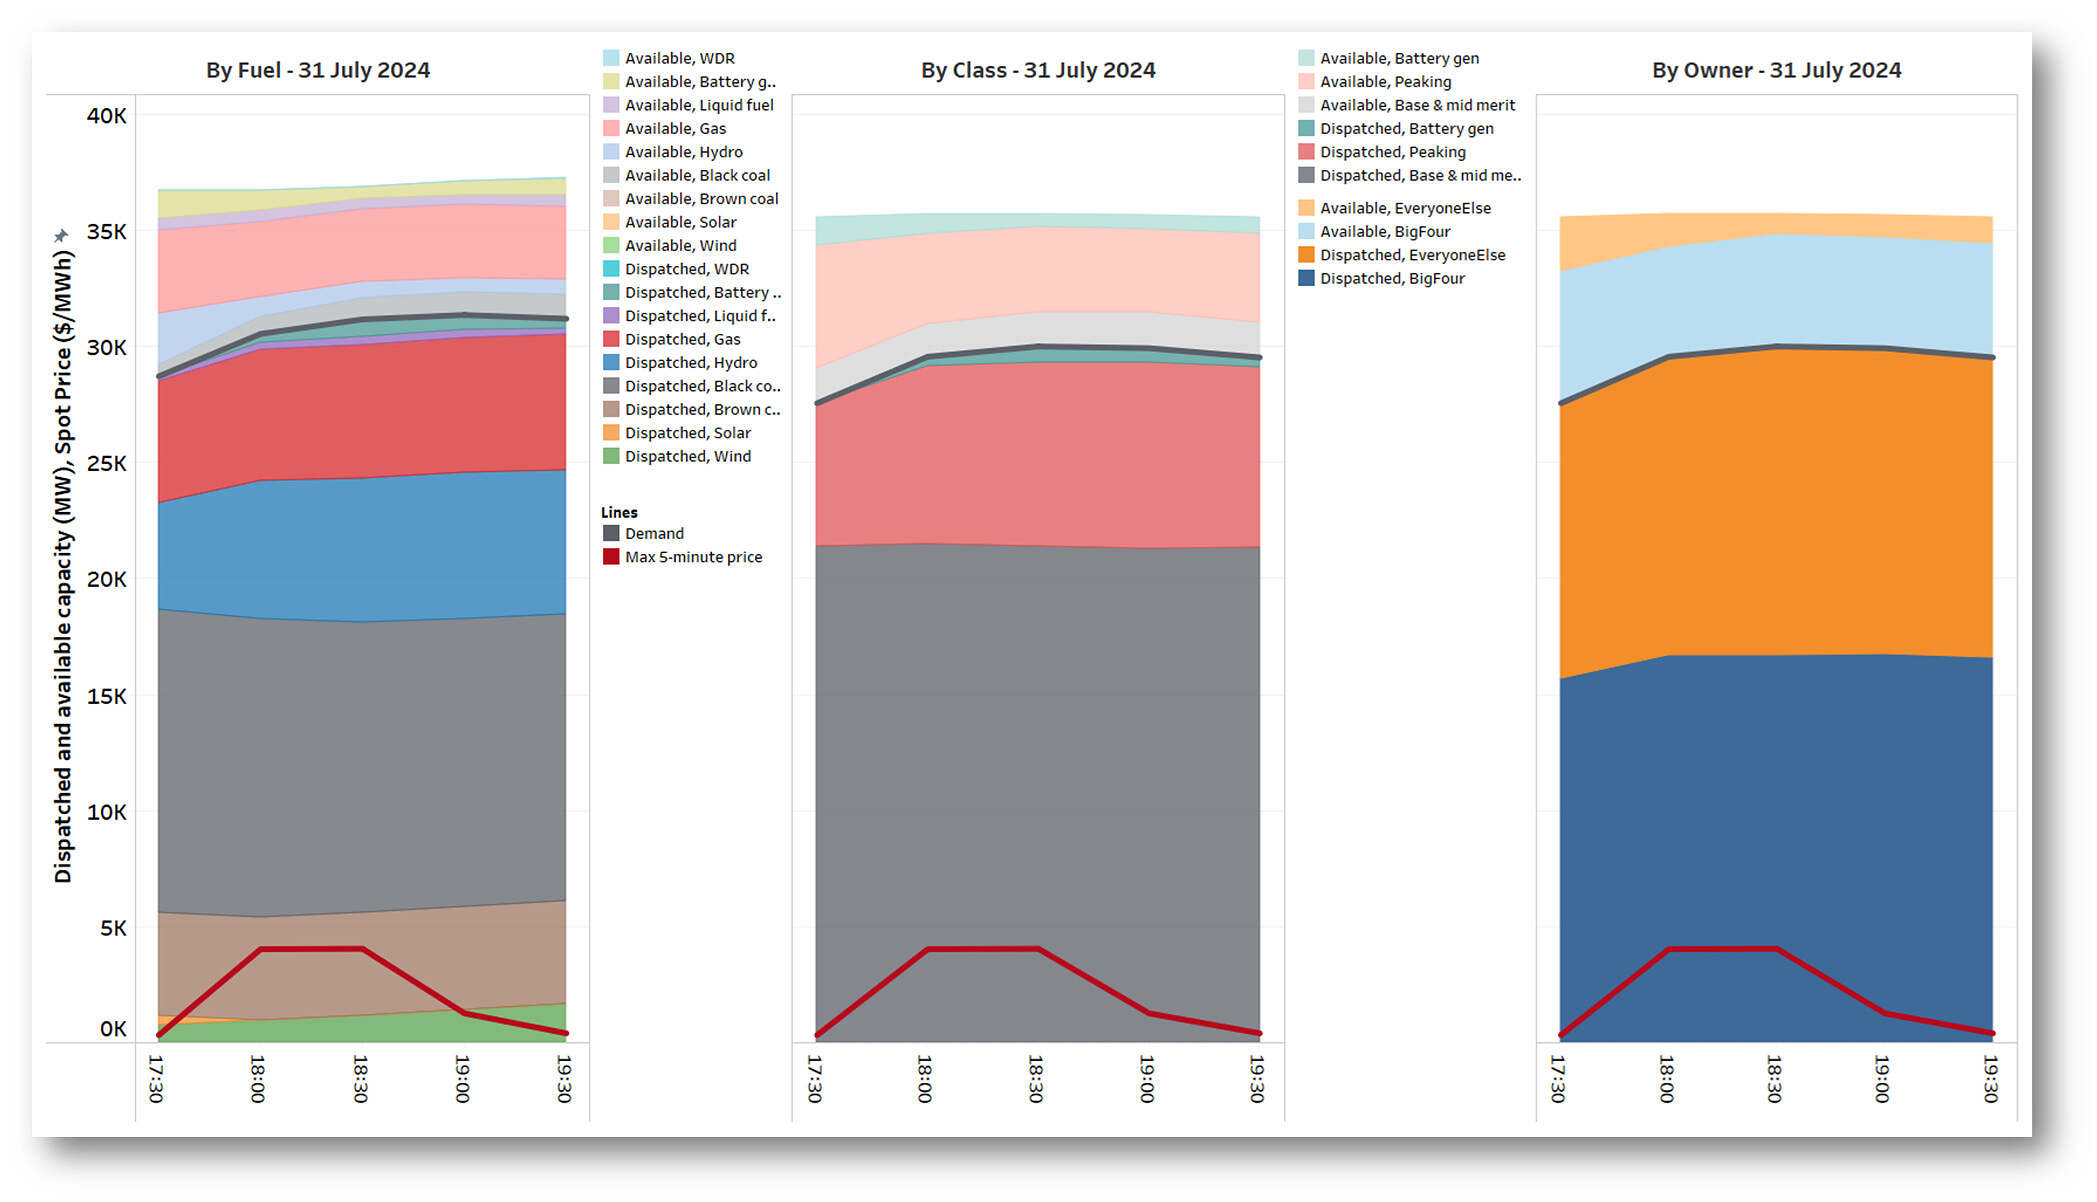
Both of these latter two NEM-wide events show similar dispatch patterns to the evening of 5 August.
Does all this mean that the large generation owners are somehow “manipulating the market” to raise prices? That would be a premature and probably naïve conclusion to jump to, especially on the basis of very limited evidence. But the question of why so much capacity was only offered to the market at extremely high prices during these events should be of great interest to all stakeholders in the market, if only to gain a better understanding of market dynamics.
A potential line of explanation would take into account the contract positions of generators and wholesale energy purchasers (typically retailers).
The spot market isn’t the only game in town
Most NEM generators have financial contract obligations to consider. These may be wholesale swap or futures derivatives traded with counterparties, or in the case of gentailers (combined generation / retail entities) “implicit contracts” which support fixed-price retail supply to their organisation’s own customers. If a generator’s physical output is less than the volume of contracts it has explicitly or implicitly sold, it must effectively buy the volume difference at the spot market price.
This provides a very strong incentive on each generation owner to “cover their contract position”, by dispatching sufficient generation in the physical spot market to at least match their sold contract volume. This incentive militates against offering contracted generation to the spot market at extreme prices – if the spot price is only a little less extreme, the generator will not be dispatched but will still have to financially settle its sold contract volumes, which could be very expensive.
Similarly, at least at times of high spot price, spot market buyers, typically retailers, would generally seek to have enough bought contract volume – and / or dispatch of their own generation (if any) – to hedge their total energy purchases from the spot market. Remember that the NEM is “gross” pool design where virtually all physical generation output and end-use consumption is settled through the spot market. Contracting activities are an adjunct to, not a replacement for, spot market transactions.
This financial and implicit contracting activity to hedge price risks was always foreseen as an important element of the NEM design complementing the spot market. We can very roughly visualize its outworkings as follows:
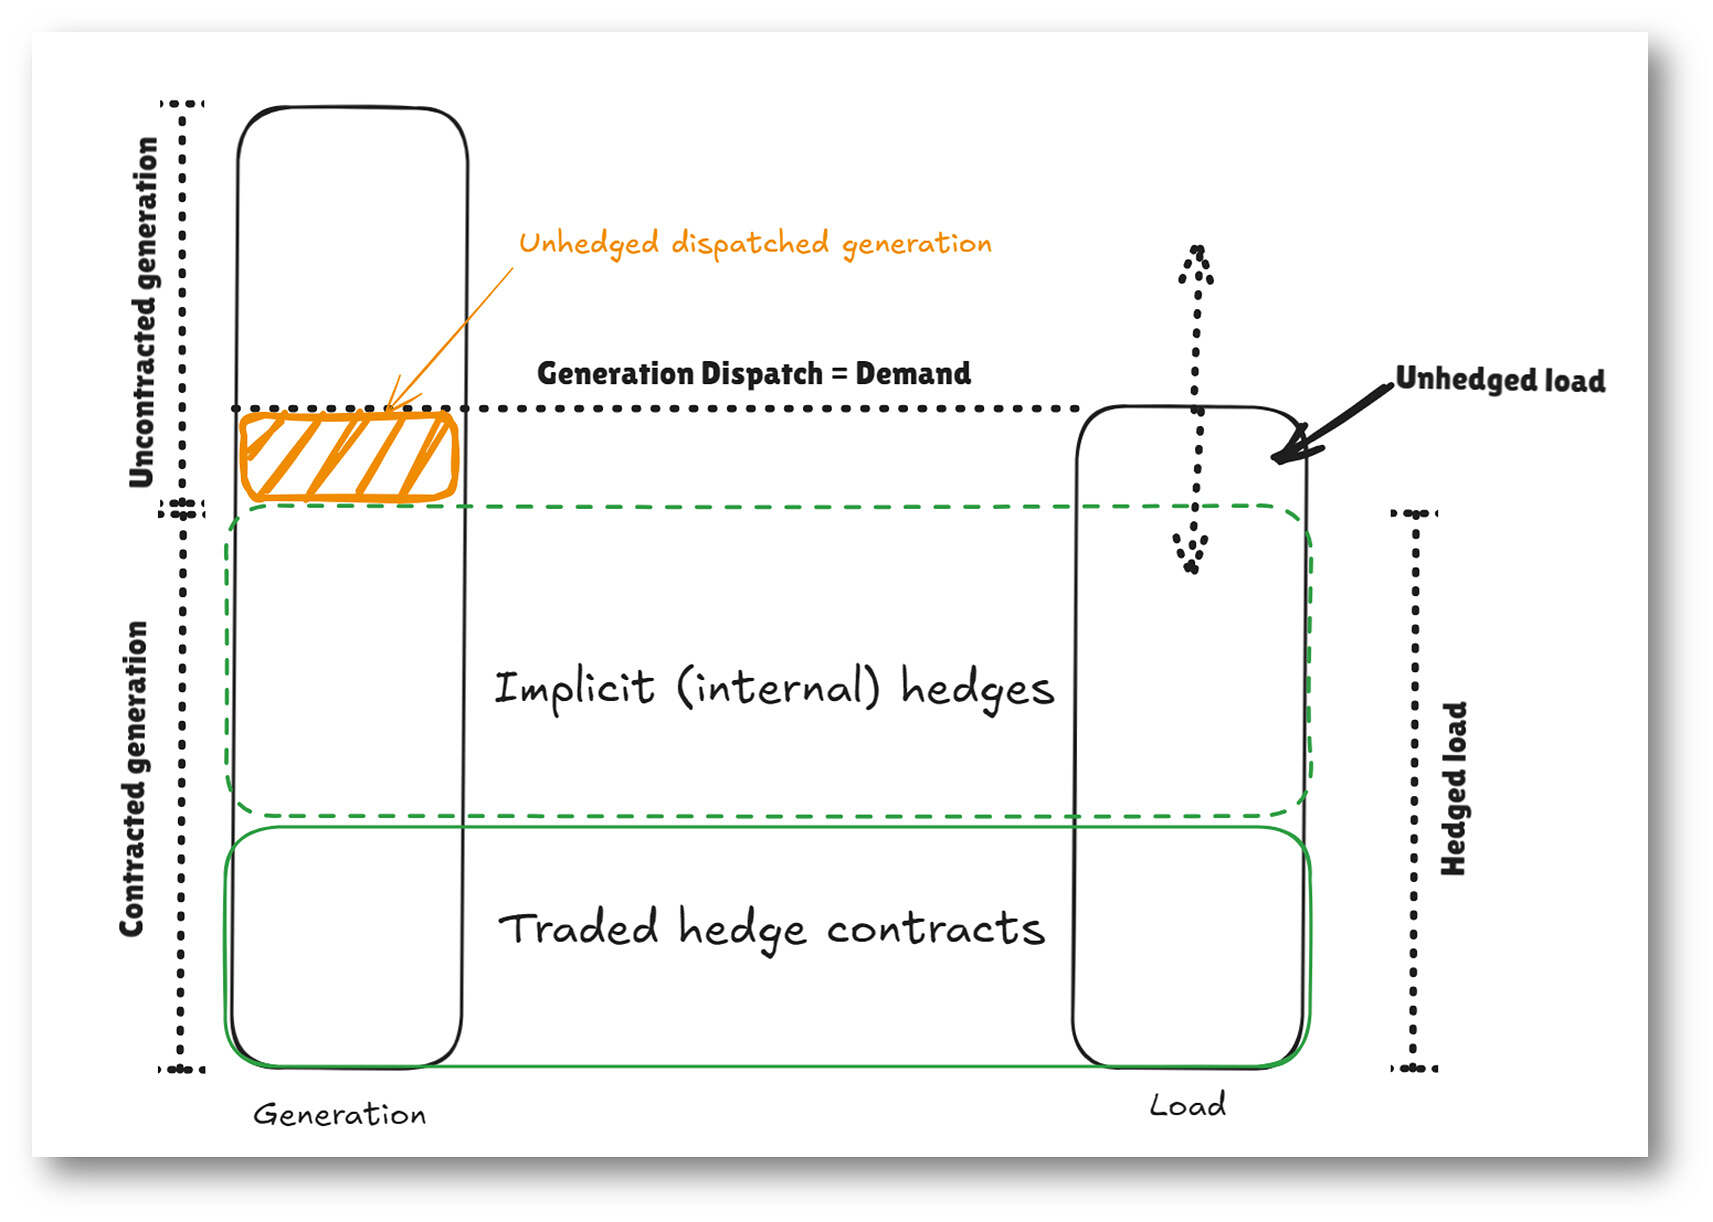
While this diagram overlays spot and contract market elements, it is critical to understand that the spot market operates quite independently of contract market activity and contracted positions. It provides a physical dispatch and spot pricing mechanism that keeps generation and load (demand) in balance. Spot market operator AEMO has no knowledge of what contracts any market participant might hold. Market participants independently manage the financial interplay of their own physical and contract positions, through how they choose to bid in the spot market and the nature of any contracting activity they undertake.
The diagram greatly simplifies contracting in the NEM, but illustrates how market loads may be partially hedged via contracts with generators, or via ownership of generation capacity (implicit hedging), or – at times – left partly unhedged, perhaps intentionally or perhaps because load is higher than expected. Load is highly dynamic across time, varying with time of day, weather, rooftop PV output and self-consumption and other factors, so the balance of hedged and unhedged load will also be highly dynamic, as will the proportion of generation that is effectively contracted or uncontracted.
For the reasons discussed earlier, when spot prices are high, generation that is contracted will have strong incentives to bid in a way that ensures a dispatch level at least meeting its contract volume. This translates to not bidding that capacity at extreme prices. However the “unhedged dispatched generation” highlighted in the diagram represents a slice of capacity that needs to be dispatched in the spot market to meet physical demand, but does not face the same contractual incentives to offer at low prices.
We can therefore think of the spot price being determined at times by rivalry amongst the owners of uncontracted generation capacity. Since contract positions are strictly private information, we have no way of knowing who those owners are at any given time, what the market aggregate levels of contracted and uncontracted capacity might be, and therefore how small or large is the slice of unhedged generation required to be dispatched, and the size of the pool competing to supply it. The best we can do is draw inferences – which may or may not be reliable – from observed spot market outcomes and behaviour.
More questions than answers
The purpose of that lengthy digression into contract market dynamics was to point out that understanding the reasons for extreme spot market prices and the bidding behaviour behind them can’t be divorced from the outcomes of the financial and implicit contracting that takes place well in advance of real time dispatch. These outcomes critically influence how participants in the spot market will bid.
In seeking answers to why the Big Four participants seem to have disproportionately bid generation at extreme offer prices in the cases examined above, we might speculate that significantly more of their generation capacity was uncontracted at the time of these events than was the case for other generation owners. A substantial volume of uncontracted generation, if offered to the market only at prices near the market cap, increases the likelihood of price spikes at times when load is higher than expected, or perhaps when other owners’ generation is unavailable (which might include low output from renewable sources that they either own or have contracted with, due to time of day and the vagaries of weather).
These contracting effects could significantly affect spot market outcomes even when the system has ample physical reserves of generation, as seems to have been the case in these recent events.
Analysing possible reasons for a (hypothetical) imbalance in contracting levels arising in the first place, and indeed whether it’s a problem or not, is a much larger topic than a post like this can cover.
The question I’d like to close with though is this:
The justification for the NEM’s very high market price cap is often presented explicitly in terms of providing adequate returns on investment for generation required to support system reliability (for example in the Reliability Panel’s recent analyses [1]).
Does the fact that other drivers – such as contracting levels and contract market behaviour, perhaps combined with ownership concentration in specific types of generation – may also lead to recurring price outcomes near that market cap mean that other aspects of the broader market design or industry structure need more attention, or simply that some participants might have been wiser in their generation development and contracting decisions than others?
[1] Modelling for the Reliability Panel’s determination of the market price cap (MPC) and cumulative price threshold (CPT) is based on finding optimum levels for these parameters that will provide adequate revenue for sufficient investment in peaking capacity to meet the market’s reliability standard. The modelling also accounts for price volatility at times unrelated to reliability events (periods of unserved energy or “USE”). This means that price outcomes at MPC during USE events are not necessarily assumed to deliver all the revenues required for this capacity. But it is not clear if or to what extent non-USE volatility – the kind examined in this post – is assumed in the Panel’s analysis to be impacted by the level of MPC / CPT selected.
=================================================================================================
About our Guest Author
 |
Allan O’Neil has worked in Australia’s wholesale energy markets since their creation in the mid-1990’s, in trading, risk management, forecasting and analytical roles with major NEM electricity and gas retail and generation companies.
He is now an independent energy markets consultant, working with clients on projects across a spectrum of wholesale, retail, electricity and gas issues. You can view Allan’s LinkedIn profile here. Allan will be occasionally reviewing market events here on WattClarity Allan has also begun providing an on-site educational service covering how spot prices are set in the NEM, and other important aspects of the physical electricity market – further details here. |
Inter-connectors not analyzed
The dispatchable power may not have been available where it was needed
You have to repeat your analysis State by State.
How close did we come to LOR1 and LOR2 warnings?
Availability of water for hydro plants may also be a factor. If the long term forecast is for dry weather that will impact on really dispatchable MW
Same for gas
Thanks for your thoughts Matt. In general some of those factors could impact regional reserve levels and prices of course. But in these specific cases of multi-region spikes:
– there weren’t binding constraints on the relevant interconnectors (which is why prices spiked jointly).
– there were no instances of actual LOR1 let alone LOR2 declarations.
– if you’re contending that being “close … to LOR1 warnings” would be sufficient explanation for prices near the MPC then I strongly disagree.
– hydro plants had enough water to offer the availability that they bid into the market. Are you seriously suggesting that the opportunity cost of undispatched water was a 5 digit offer price?
– for gas, see water.
Of course you’re welcome to run and present your own analysis of the individual region cases including interconnectors, I’d be genuinely interested in your results and conclusions.
Cheers
Allan
Would be interesting to unpackage these events to see who / what was the marginal cost generator. This is the problem with energy only markets. Batteries have no hope of paying their way without a very large spread on their energy arbitrage. Gas turbines have to cover their start up costs (loss of life of very expensive hot gas path components) over a relatively short generating window the duration of which the generator needs to predict before committing to run. This will only get worse as coal plants are pushed out of the market. From their min gen position, they can ramp to max relatively cheaply. Once they have to be decommitted it takes a long period of predicted generating time to amortise a restart. This is where the gentailers have inherent advantage.
Thanks for your comment Andrew. I’m not sure that the identity of the marginal generator is all that important here – there were signficant volumes offered at 4 and 5 digit prices from all fuel types other than solar and wind, and by more than one participant. I think that’s the key observation; which specific generators happened to be marginal in the high price intervals doesn’t really add any information, since there were clearly a number of participants offering at very similar prices. Allan