
Yesterday’s price volatility, observed in Energy price volatility on 30th July 2024, lasted longer than expected in SA.
In in initial pass to review contributing factors, this article discusses energy bids as dispatched.
We take a top-down look at bids by Fuel Type / Technology using the ‘Bids & Offers’ widget in ez2view, time travelled back to 22:30 on Tuesday 30th July 2024. We look back 6 to 12 hours to capture the high-priced intervals and provide some context from the late afternoon.
The screenshots:
1) Show ‘final bids’ (i.e. for each dispatch interval it shows the bids that NEMDE took into account in its dispatch process for that dispatch interval).
Meaning we only see the final outcome of rebidding behaviour that impacted dispatch.
2) Focus primarily on SA. However we acknowledge that other regions also experienced elevated prices around 18:00.
3) Only present bids in the ENERGY market.
Disclaimers
First and foremost, readers should keep in mind the following disclaimers:
1) This analysis performed and published on Wednesday 31st July as an initial first pass.
(a) We acknowledge the focus on bids does not explain the whole story, but we use it to flag top-down things that may see us direct more detailed focus in the days and weeks ahead, time permitting (i.e. we actually have other things to do as well!)
(b) It’s done quickly, so there’s increased potential for mistakes in opting for speed.
i. If any readers spot mistakes, it would be appreciated if you could point them out (in comments below, or directly);
ii. If we become aware of mistakes we may update this article, but it’s not guaranteed.
2) We’ve noted below that ‘the NEM is a complex place’, and readers should keep in mind the interconnected nature of the NEM, in several dimensions:
(a) Firstly, it’s probably obvious to most people that just zooming in on bids in South Australia will overlook any impacts that came in the ENERGY market of other regions;
(b) Perhaps less well understood will be the ’interconnections’ across all 11 commodities (i.e. ENERGY and 10 x FCAS commodities).
i. Just focusing on ENERGY will almost certainly overlook outcomes related to co-optimisation.
ii.. We noted that some FCAS prices also spiked in the 18:00 interval.
(c) Finally, worth also noting that this analysis just focuses on the ‘physical’ ENERGY market operated by AEMO.
Tips in reading these ez2view charts…
A few background tips on how to read these charts – which are from the ‘Bids & Offers’ widget in ez2view:
1) We’ve added the spot price for the region of interest on these charts to provide you a reference point for the bidding activity.
2) There are lines for availability and power (output or consumption), targets are indicated in grey but generally not visible on the charts presented in this article’s top-down analysis.
3) Bids are ‘capped at dispatch target’. This is different to ‘capped at dispatch availability’, as the volumes available but not dispatched are omitted.
(a) This means we see a gap between the top of the bid stack and availability. The gap represents the portion of volume offered and available but not dispatched (up to the availability line).
(b) It’s important to note that there are MWs offered all the way up to the availability line, just that these turn out to be higher-priced than the dispatch price, hence not dispatched.
(c) By capping at dispatch target we see the bid volumes that were used in dispatch. The volumes in price buckets therefore (generally) align with the energy price series and there is a clearer distinction between what was available and what was dispatched.
(i) When we see a thin sliver of red at the top of the capped bid stack we can observe how it was only that visible portion that was dispatched. Higher priced offers would have sat above that dispatched level.
4) Users can create their own bid price buckets, and assign colours of their choice – but it makes sense (at least in this top-down review) to use the ‘Default Price Buckets’ which use three basic colour ranges:
(a) BLUE = $0/MWh and below (with –$1,000/MWh being light blue … there’s a lot of that!).
(b) GREEN = Above $0/MWh to $300/MWh
(c) PINK and RED = Above $300/MWh.
(d) GREY = eagle-eyed readers might spot a bit of grey near the 0MW line, which represents ‘Fixed Load’ (i.e. ‘must run’ price-taker bids).
5) When seeking to inspect the images in more detail, remember you can click on an image to open it as a larger view in another tab.
SA energy bids – all units
Reminding ourselves that the energy bids presented below are ‘Capped at Dispatch Target’ (it’s one of several options offered by ez2view … this option just takes the bids that were actually dispatched, so meaning the white space up to the dotted red ‘Availability’ line also contained bids … but these were not dispatched).
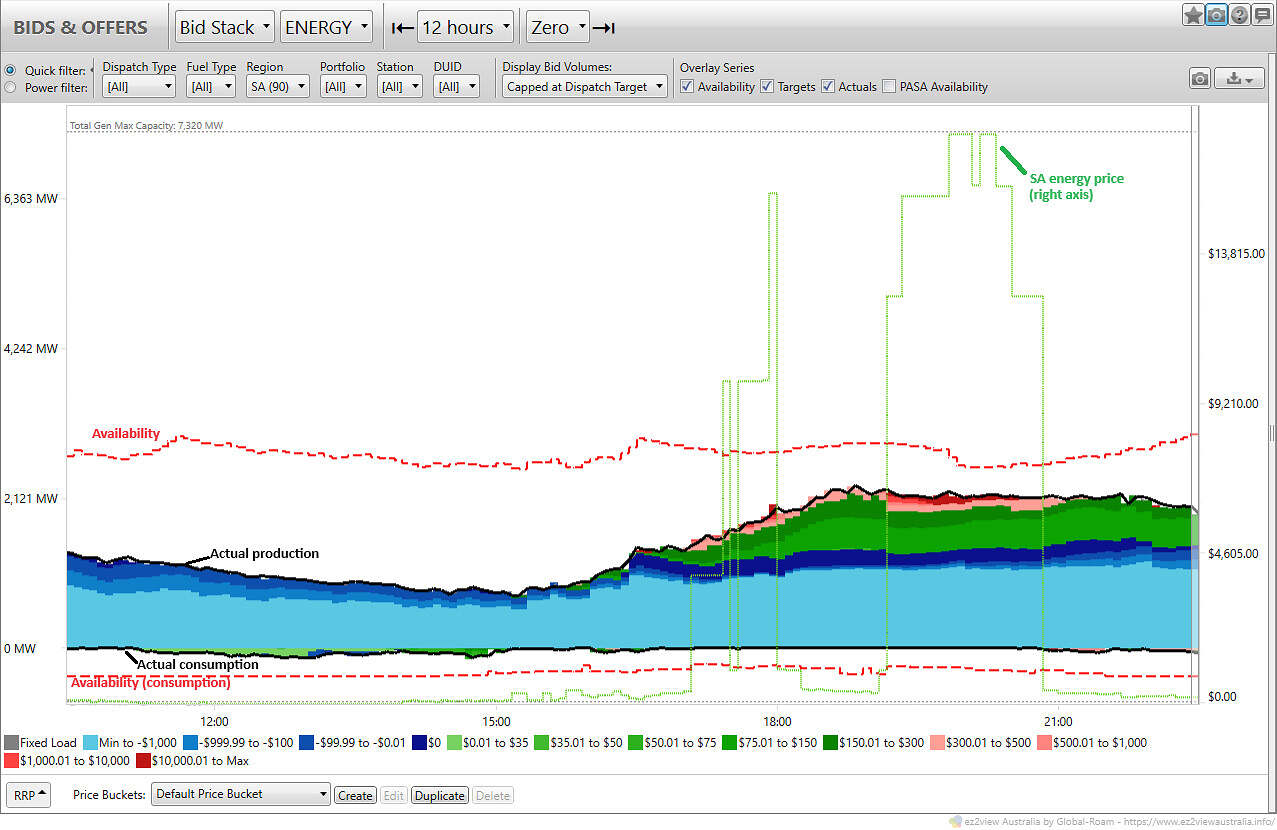
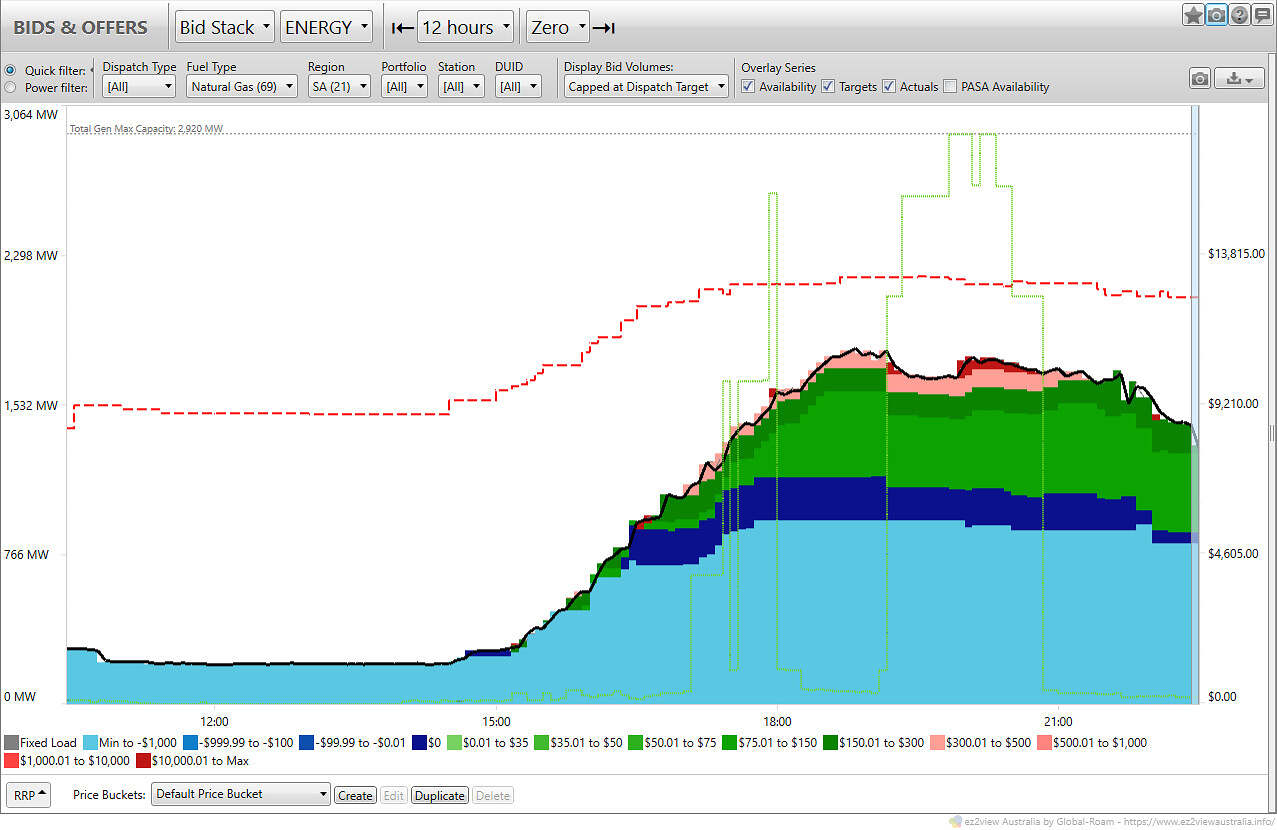
SA ENERGY bids (all units)
Observations from the ‘all units’ overview:
- Energy output was increasing since 15:00 and peaked at 2,306 MW at 18:50.
- There were two periods of volatility;
- 17:10 – 18:00
- 19:15 – 20:50
- Around 16:30, there was an increase in volume offered in the low-priced buckets, it coincided with an increase in availability also.
- A distinct shift of volume between price buckets occurred at the start of the second volatility period, 19:15. With reduced volume in Green, and increased volume in stronger-Red buckets.
- There was a reduction in availability leading into to the dispatch interval of 20:00. This was the time from which the actual LOR1 condition was declared. The LOR1 lasted until 20:40.
SA energy bids – Solar
The next screenshot captures the bids as dispatched from large-scale solar units.
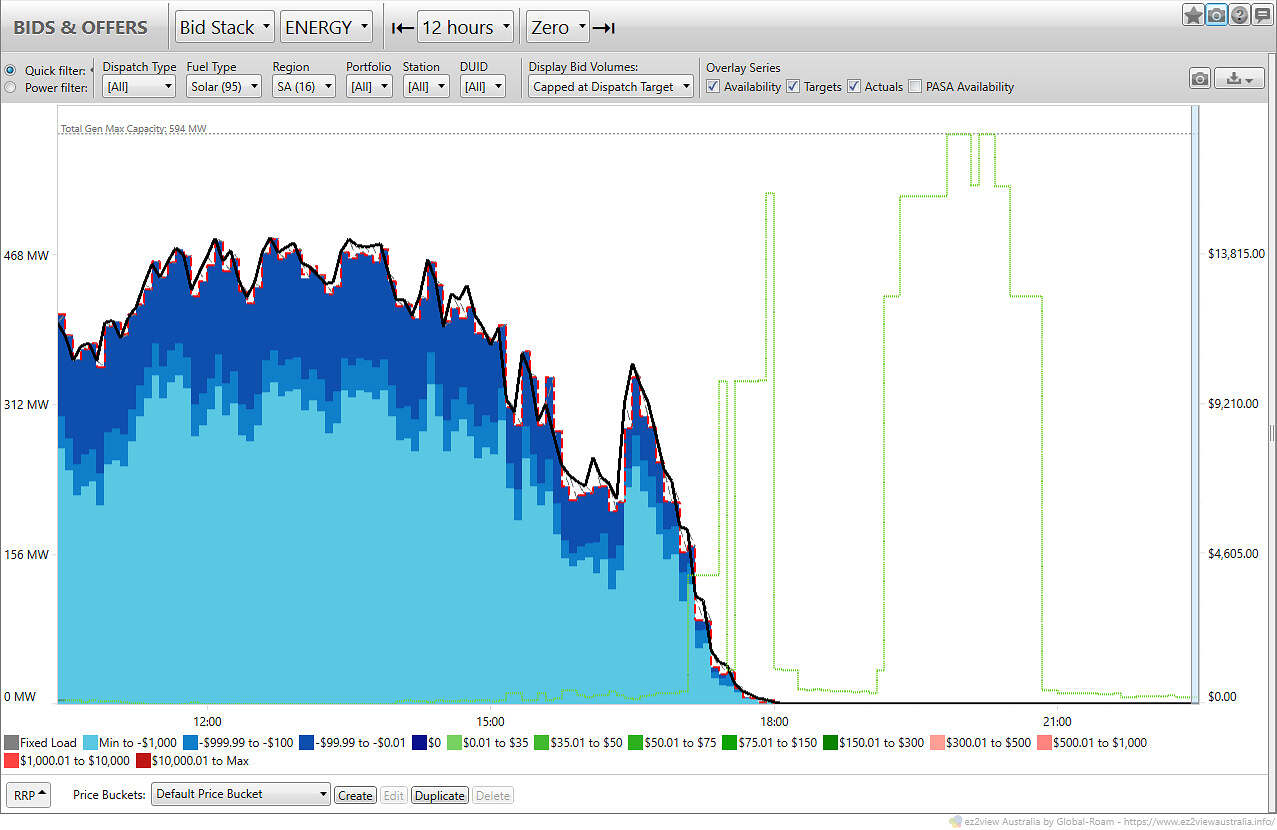
SA ENERGY bids (Solar)
Observations from the overview of Solar unit bids:
- Prices began their march into the 3,000 $/MWh range as output was declining. The first interval, 17:10, coincided with production levels at 113 MW.
- All dispatched volumes were offered at low prices.
- Availability generally matched output indicating full output, for the resource potential at the time.
SA energy bids – Wind
Perhaps the first thing evident in the next screenshot is that there wasn’t a whole lot of wind around.
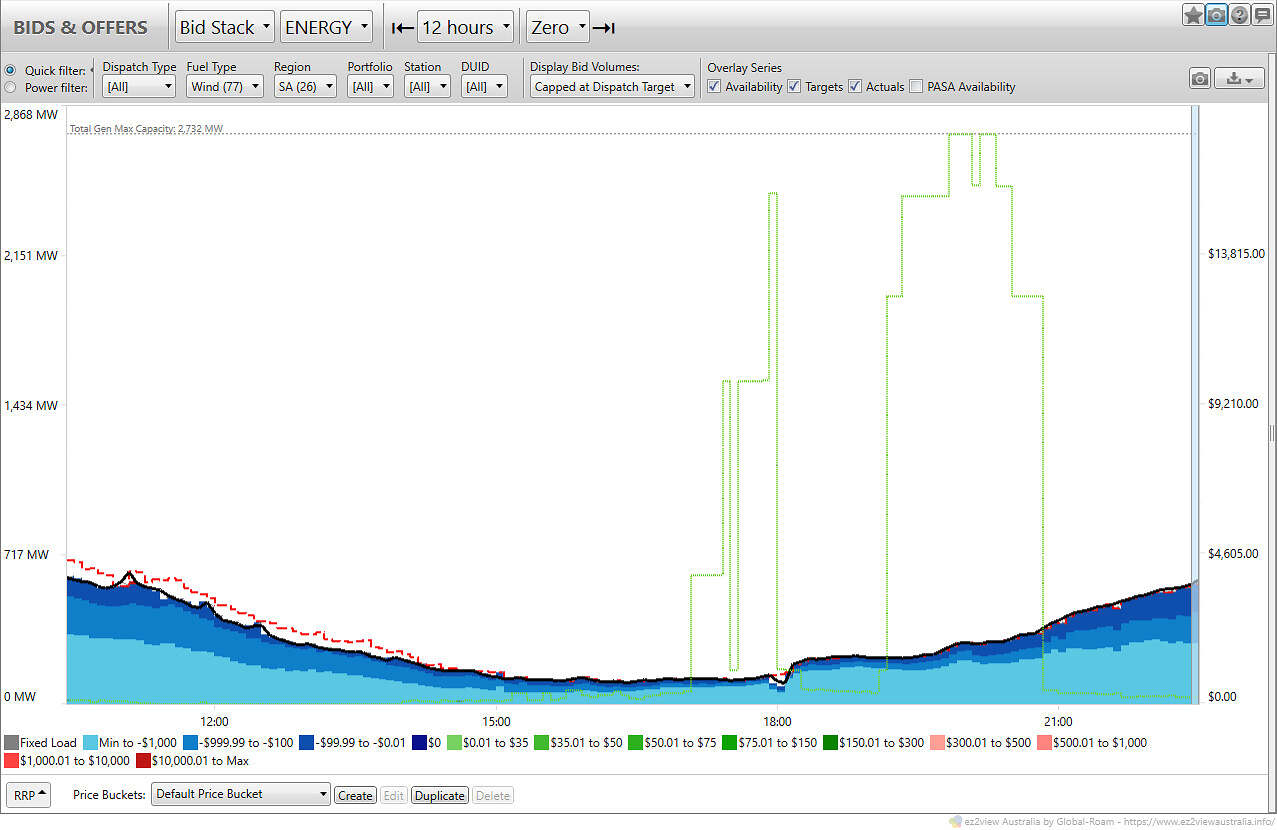
SA ENERGY bids (Wind)
Observations from the overview of Wind unit bids:
- Prior to 15:00 there was some curtailment – availability was not fully dispatched.
- After 15:00 there was very little curtailment.
- At the beginning of the first volatility period 17:10 wind output was 124 MW.
- Available volumes were all offered below 0$/MWh across the evening.
- By the end of the second high-price period, 20:50, output had crept up to 363 MW.
SA energy bids – Diesel
Diesel units were dispatch with offers generally in the 150 – 300 $/MWh range.
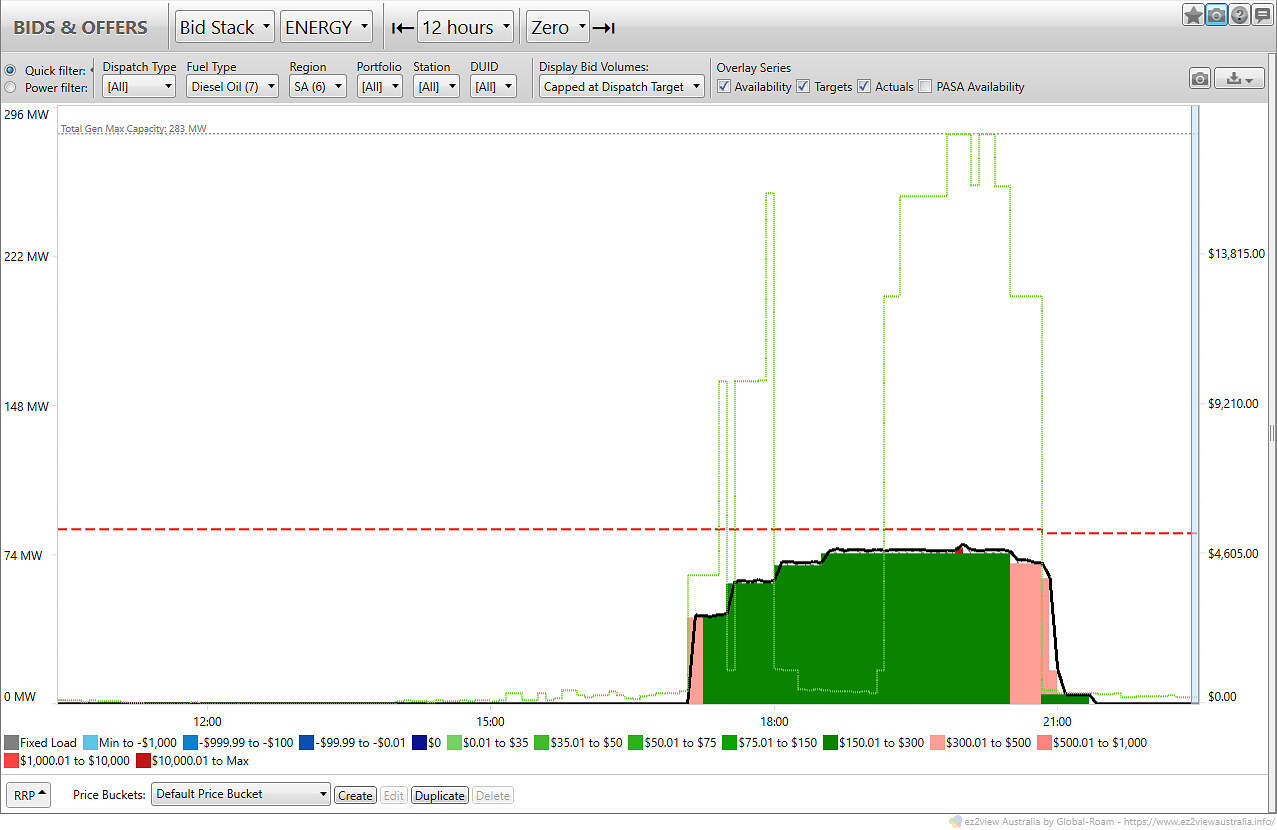
SA ENERGY bids (Diesel)
Observations from the overview of Diesel unit bids:
- Output aligned with the beginning and end of the high price periods.
- Angaston, Lonsdale and Port Stanvac contributed energy.
- Units on the path to decommissioning – Port Lincoln and Snuggery – did not run. These units are not yet deregistered and as such are included in the Max Capacity total on the chart.
SA energy bids – Gas
Gas units ramped up from 15:00 and higher-priced volumes were progressively offered.
SA ENERGY bids (Gas)
Observations from the overview of Gas unit bids:
- The distinct shift of volume between price buckets that occurred at the start of the second volatility period, 19:15, and was noted in the ‘all units’ screenshot, is apparent here. Now attributed to gas unit rebids.
- Barkers Inlet rebid their full availability (140MW) at the market price cap for the 19:15 interval.
- There was more MWs available than dispatched (around 400 MW available in reserve).
SA energy bids – Battery Storage
Battery storage output was strong for the first high-price period, but managing the duration of the event proved difficult.
The second high-price period saw energy production availability drop to 29 MW at 20:00, relative to the earlier high point of 396MW. This time aligned with the declaration of a LOR1 condition, though we aren’t able to assign any causal link in this high level inspection.
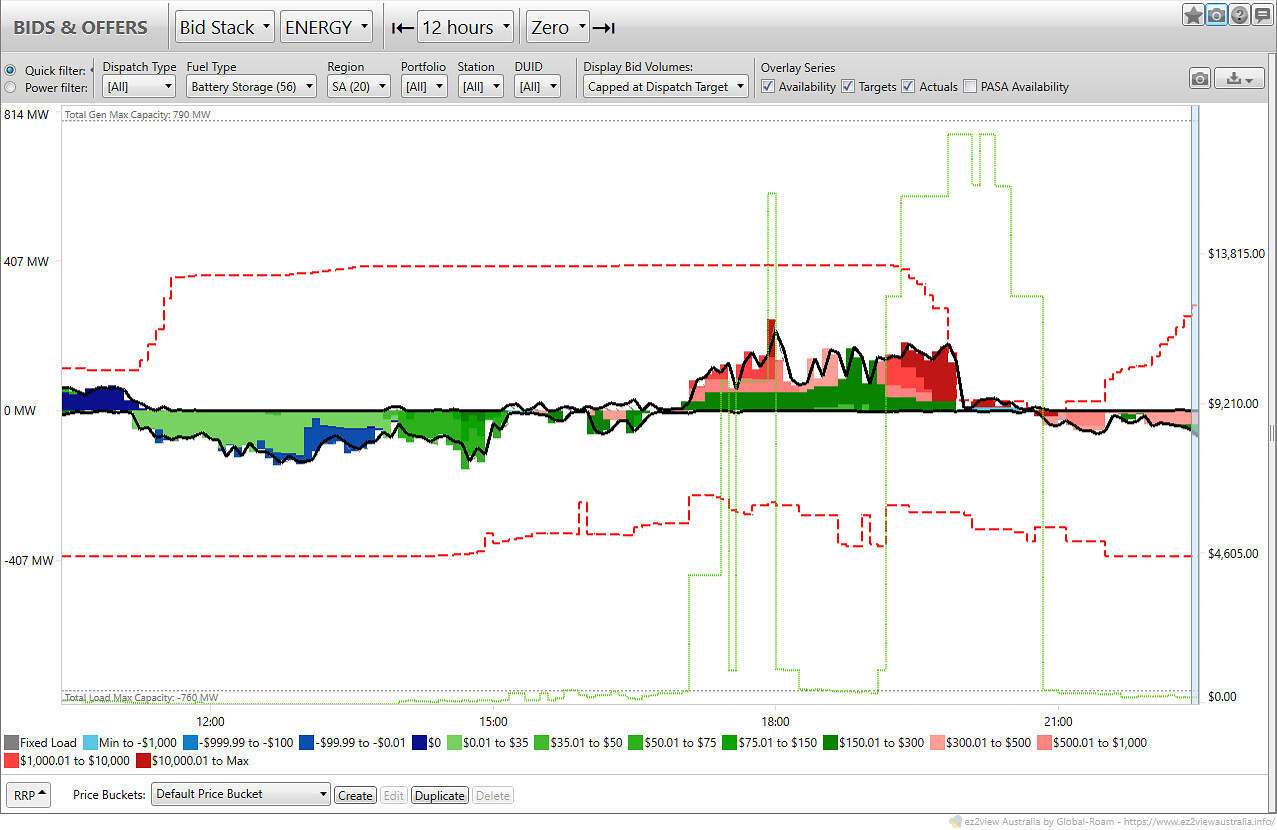
SA ENERGY bids (Battery Storage)
Observations from the overview of Battery Storage unit bids:
- Rebid reasons referencing state of charge management or ‘close to limit’ were referenced in rebids around 20:00.
- Some consumption (15 MW) was dispatched for Torrens Island BESS in the last high-price interval, 20:50, where the energy price was 12,500 $/MWh.
- Aggregate production availability levels began to increase from around 22:00 after and in conjunction with a somewhat better (relatively) price setting for charging.
SA energy bids – Demand Side
No negawatts were dispatched in the time period we’ve focused on. Zero-MW availability was offered from the single unit registered in SA.
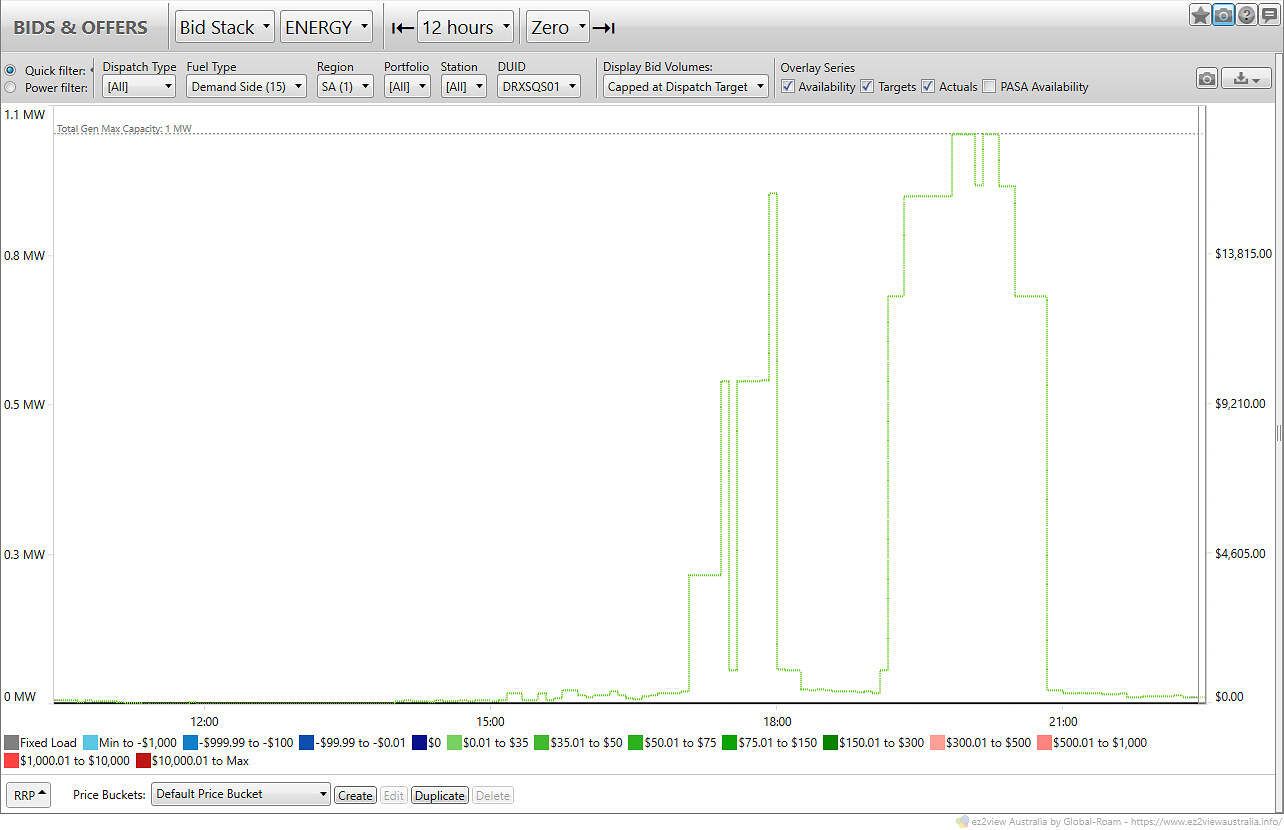
SA ENERGY bids (Demand Side, aka Negawatts)
Key takeaways
Here are my 5 takeaways, at the high level:
- The peak happened in the evening, and winter. Apart from a couple of early intervals, the sun had set on solar farms by the time the high prices had established themselves.
- Wind output was low leaving demand to be met by higher priced offers from dispatchable firming resources.
- Gas units appeared to price upper-end volume at higher price bands and were dispatched.
- Longer duration storage would have been of use to the battery fleet, to contribute more in the second high-price period.
- Diesel units ran and aligned with the high price periods.
PS1
We didn’t cover other drivers of the high prices in this article. One key component worth mentioning at this point however (as it is related to supply of energy in SA) is the capacity of the two interconnectors to VIC.
- The Heywood interconnector was constrained for much of the period- constraints V_VS_LB_HY_50 and VS_050_DYN were restricting transfers into SA to below 50MW when typical capacity can be 600MW.
- Murraylink, the HVDC interconnector (capacity 220 MW) was on an outage. It returned to service on the 31st of July.
At the beginning of the first volatility period 17:10 wind output was 124 MW.
This is despite SA having 2GW of installed wind generation capacity. So a capacity factor of just 4%
It would seem the lack of competition from Victoria (or NSW via EnergyConnect) contributed to the high pricing. Of course more battery operators combined with additional storage capacity would have assisted as well.