Yesterday as the 3rd article for the day (all partly related to Wednesday 8th May 2024, and partly related to the deliberations about the looming closure of Eraring):
1) we’d posted about ‘‘Another challenging week’ for VRE NEM-wide, beginning Wednesday 8th May 2024’;
2) referencing comments made by David Osmond, who’s been running an interesting (though simplistic) weekly modelling exercise for a number of years.
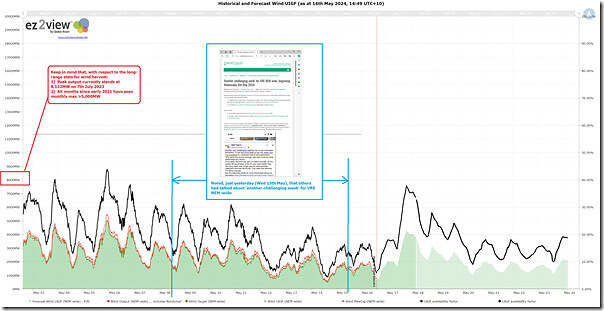
In this short follow-on today, here’s an image captured at 14:49 (NEM time) on Thursday 16th May 2024 from the live-updating dashboard from ez2view ‘Trends Engine’ highlighting that the relatively low wind conditions look set to continue for another week … via the AEMO’s UIGF for Wind NEM-wide in P30 predispatch and ST PASA:
Low wind in May 2024?
With respect to the 21-day trend above (14 days historically and 7 days forecast) it looks likely that May 2024 will be significant, as a low-point for wind yield for the month:
1) Eyeballing this chart, the highest production point in the 2-week historical range was ~5,500MW at the day late on Sunday 5th May 2024;
2) Using the AEMO’s P30 predispatch forecast, this might be exceeded briefly tomorrow evening (Friday evening 17th May), but not by too much … will have to wait and see.
Compared with history?
The last time we added to this series of articles of long-term wind production statistics was back in April 2024. From this we can see that:
1) The all-time maximum production is still currently base on what happened on Friday evening 7th July 2023, when the aggregate wind production peaked at 8,132MW at 19:20.
2) We’d have to look back to April 2022 to see a month with lower peak production (5,252MW):
(a) and since that time, the installed capacity base* has increased by ~1,500MW
* remembering these caveats about the sometimes overlooked complexity of quoting installed capacity.
(b) so will be interested to see how the monthly capacity factor actually calculates out to be at the end of the month!


Leave a comment