
In this post I’ll try to unpack AEMO’s slightly cryptic announcement of a Scheduling Error (Incident 60) which resulted in underestimation of NSW operational demand from 24 January to 7 March this year. Paul’s initial post contained AEMO’s description of the event, repeated here:
‘From 0850 hrs on 24/01/2024 to 1845 hrs on 07/03/2024, an error in the Energy Management System (EMS) NSW generator calculation resulted in an underestimation of NSW operational demand and an under-dispatch of generators across the NEM, equivalent to the generation target of Tallawarra B (up to 320 MW).
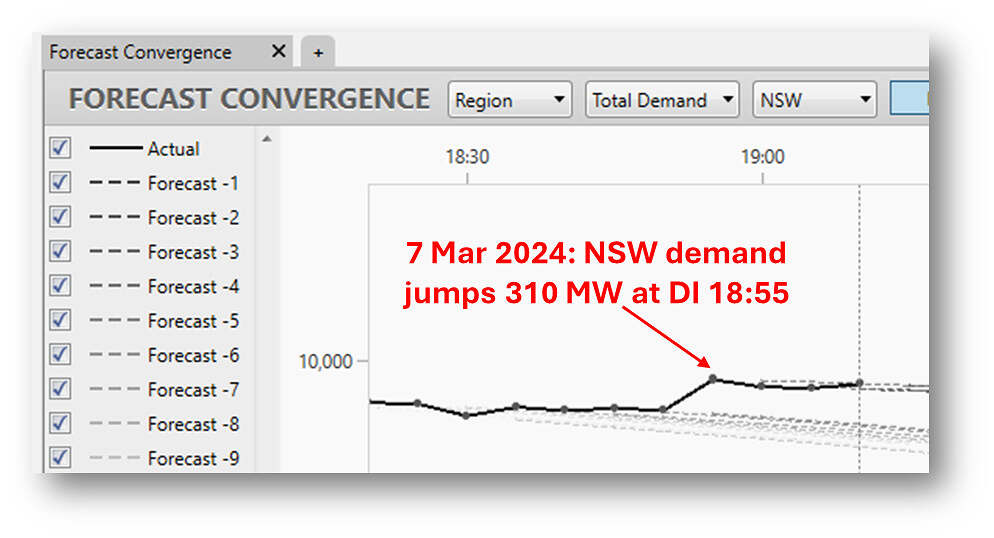
From 1845 hrs on 07/03/2024 to 1920 hrs on 07/03/2024, a temporary fix corrected the NSW operational demand calculation, but incorrectly dispatched Tallawarra A when it was out of service, resulting in under-dispatch of the remaining NEM generation by approximately 275 MW.
The errors resulted in under-dispatch of 146 MW on average for approximately 100 hours.’
What does this mean in ordinary English? To decode it, we have to start by detouring yet again through how electricity demand is measured in practice.
Demand = Supply
At wholesale market or grid level, electricity demand is defined in terms of supply. The grid doesn’t store electric power, just transmits it from point to point at light speed, so what goes out of the grid every millisecond (demand) must equal what goes in (supply). Because supply comes from a relatively small number of very large sources, namely generators (and if we’re measuring at regional level, interconnectors), it’s more convenient to measure demand from the supply end.
Without getting into its many arcane variants, we can therefore say that in the NEM:
Demand = Sum(Generator outputs) +/- net interconnector transfers
This is exactly how AEMO measures actual live demand on the grid, with the proviso that this measurement is limited to generators which provide real-time SCADA feeds of their instantaneous power output.
SCADA = “Supervisory Control And Data Acquisition” and is a generic term for interchange of real-time measurement and control information across all sorts of industrial processes. In the NEM, SCADA systems allow AEMO, network operators, and individual generators to exchange a wide range of information on the state of the grid, comprising thousands of individual measurement and control signals, including real-time generator outputs, typically at four-second intervals.
This covers the vast majority of the grid’s supply sources, with the notable exception of the millions of rooftop solar PV systems supplying about 10-12% of the energy consumed across the NEM. AEMO’s demand measures exclude this contribution (and those from a few pretty small “embedded” generators connected into local distribution networks, usually smaller than 5 MW), meaning that AEMO’s metrics encompass the demand met from large-scale sources only.
Of course it’s possible to estimate the supply from rooftop PV using data on the location and capacity of installed systems (provided by the Clean Energy Regulator’s database) and various sampling approaches. This allows more comprehensive estimates of overall consumption, such as “Underlying Demand”, to be made. But for most purposes and certainly for real time power system management, the narrower SCADA-based grid demand measures are most relevant.
Market Demand and Supply
In running the NEM’s wholesale spot market, AEMO’s task is to schedule market supply into the grid so that it balances demand. But what measure of demand?
Since only large market-scheduled generators (and a few “scheduled loads”) are dispatched via the spot market, the appropriate demand metric for balancing the wholesale market, or at least the appropriate starting point, is: whatever all those large market-scheduled generators and loads are producing / consuming right now. Factoring in interconnectors as well, this gets us back to something very close to my initial demand definition:
Market Demand (measured) = Sum(Market Generator Production)
– Sum(Scheduled Load Consumption)
+/- Net interconnector transfers
All the information needed for this measure is available from real-time SCADA feeds, since a condition of being a market generator or scheduled load is being SCADA-connected to AEMO.
AEMO can measure market demand for each NEM region every four seconds via SCADA, but the market scheduling process runs at five-minute intervals, and therefore starts with a demand snapshot constructed just before the start of every dispatch run by adding up all the latest SCADA measurements from generators, loads and interconnecting transmission lines.
This measurement is labelled INITIALSUPPLY in AEMO’s dispatch datasets. Anyone who is really keen can reconcile this measure to the individual values for the generators/loads and interconnectors relevant to each NEM region (labelled INITIALMW and METEREDMWFLOW respectively).
In scheduling the market for the following dispatch interval, AEMO makes a few adjustments to INITIALSUPPLY – principally by adding a forecast for the expected change in demand over the next five minutes – ending up with a market scheduling input called TOTALDEMAND.
(a) Except that it’s not really “total demand” in ordinary parlance, since it excludes rooftop PV and non-market supplies, includes a forecast component, nets off the consumption of scheduled loads, and has a few other wrinkles – but it is the appropriate number for scheduling purposes).
(b) The team at Global-Roam have taken to referring to this (i.e. TOTALDEMAND) as ‘Market Demand’, as it’s the starting point for determining the dispatch outcomes and prices in the market. But that’s not an official term used by the AEMO.
Missing megawatts
Now we’re ready to decode AEMO’s Scheduling Error. Suppose a new large-scale, market scheduled generator comes onto the grid, having gone through all the relevant registration, connection, and testing protocols, and starts bidding and operating in the market. But what if a configuration oversight somewhere in AEMO’s systems means that new generator’s SCADA output isn’t being included in the demand snapshot that feeds market scheduling via the INITIALSUPPLY measure?
Obviously, the first consequence is that AEMO’s measure of market demand will be too low, by whatever quantum of output the “overlooked” generator is physically producing. Suppose that all the relevant SCADA feeds add up to 1,000 MW, with the overlooked unit producing 100 MW of that total. That 1,000 MW is the appropriate physical measure of market demand.
But the bookkeeping oversight means that AEMO’s systems miss that 100 MW, and record market demand of only 900 MW. Let’s assume nothing is forecast to change over the next dispatch interval, and that the overlooked generator is again dispatched to supply 100 MW. This means that all the other contributions to market supply – generation, load and transfers – will be scheduled to produce a net 800 MW. If physical demand remains at 1,000 MW, these scheduled supplies will be insufficient to the tune of the 100 MW missing from AEMO’s demand measure.
This doesn’t mean the lights will go out. If input to the grid doesn’t keep pace with demand, grid frequency immediately starts drifting downwards (physically, the extra power needed comes from large synchronous generators’ kinetic energy of rotation being converted to electrical energy as they slow down). In response to falling frequency the real-time frequency control measures embedded in operation of the grid – in particular Regulation FCAS and primary frequency response will then operate to increase supply and keep things in balance. The effect of these responses is that, in total, generation and power transfers scheduled to supply only a net 800 MW will in fact correct to supply the 900 MW physically required.
At this point, someone may ask how the new generator could be bidding and getting scheduled at all if its SCADA-measured output isn’t being included in AEMO’s demand measurements? The answer is that the processes of market scheduling and demand measurement are quite separate, although obviously linked. Demand measurements are calculated by AEMO’s operational Energy Management System (EMS) and fed – along with lots of other stuff – to the NEMDE market optimisation software that schedules the spot market. An oversight in the EMS’s demand calculation isn’t visible to NEMDE nor does it stop it doing its job. It just gives NEMDE an incorrect scheduling target to work with.
At the start of the next dispatch interval, the 900 MW being physically produced / transferred by the non-overlooked sources will again be measured as “market demand”, and if the overlooked generator were again scheduled for 100 MW, everything else would again be scheduled for 800 MW – rinse and repeat.
Now, since the “missing megawatts” in AEMO’s market demand calculation will still get physically produced somewhere, thanks to the wonders of frequency control, what’s the issue? There are several:
- The sources that supply the extra 100 MW in our example – via frequency control actions – won’t be the same as those which would have been scheduled if the market demand number had been correct. Some generators will have missed out on producing energy because their scheduled targets were lower than they should have been.
- Market prices will be affected – all other things being equal, lower market demand means lower market prices.
- Correcting for configuration errors that affect market scheduling isn’t what frequency control is there for – it’s meant to deal with real events and changes that impact the power system, not bookkeeping problems.
Tallawarra B
Obviously that last section isn’t purely hypothetical – it’s describing the essentials of what happened with the commissioning of the new Tallawarra B gas-fired unit, which began on 24 January this year. In this commissioning period Tallawarra B operated only intermittently.
However AEMO’s notification indicates that any output Tallawarra B did produce wasn’t being added into AEMO’s measurement of NSW demand. But the infrequent running of the unit and its relatively small output (only a couple of percent of typical NSW demand when online) meant that the impact of this oversight was far from obvious.
Who knew?
Only people looking very closely at system frequency behaviour or usage of frequency control services like Regulation FCAS might have noticed something a bit odd going on when Tallawarra B was running. My guess is that AEMO’s operational team eventually picked this up, leading to investigations and then declaration of the scheduling error.
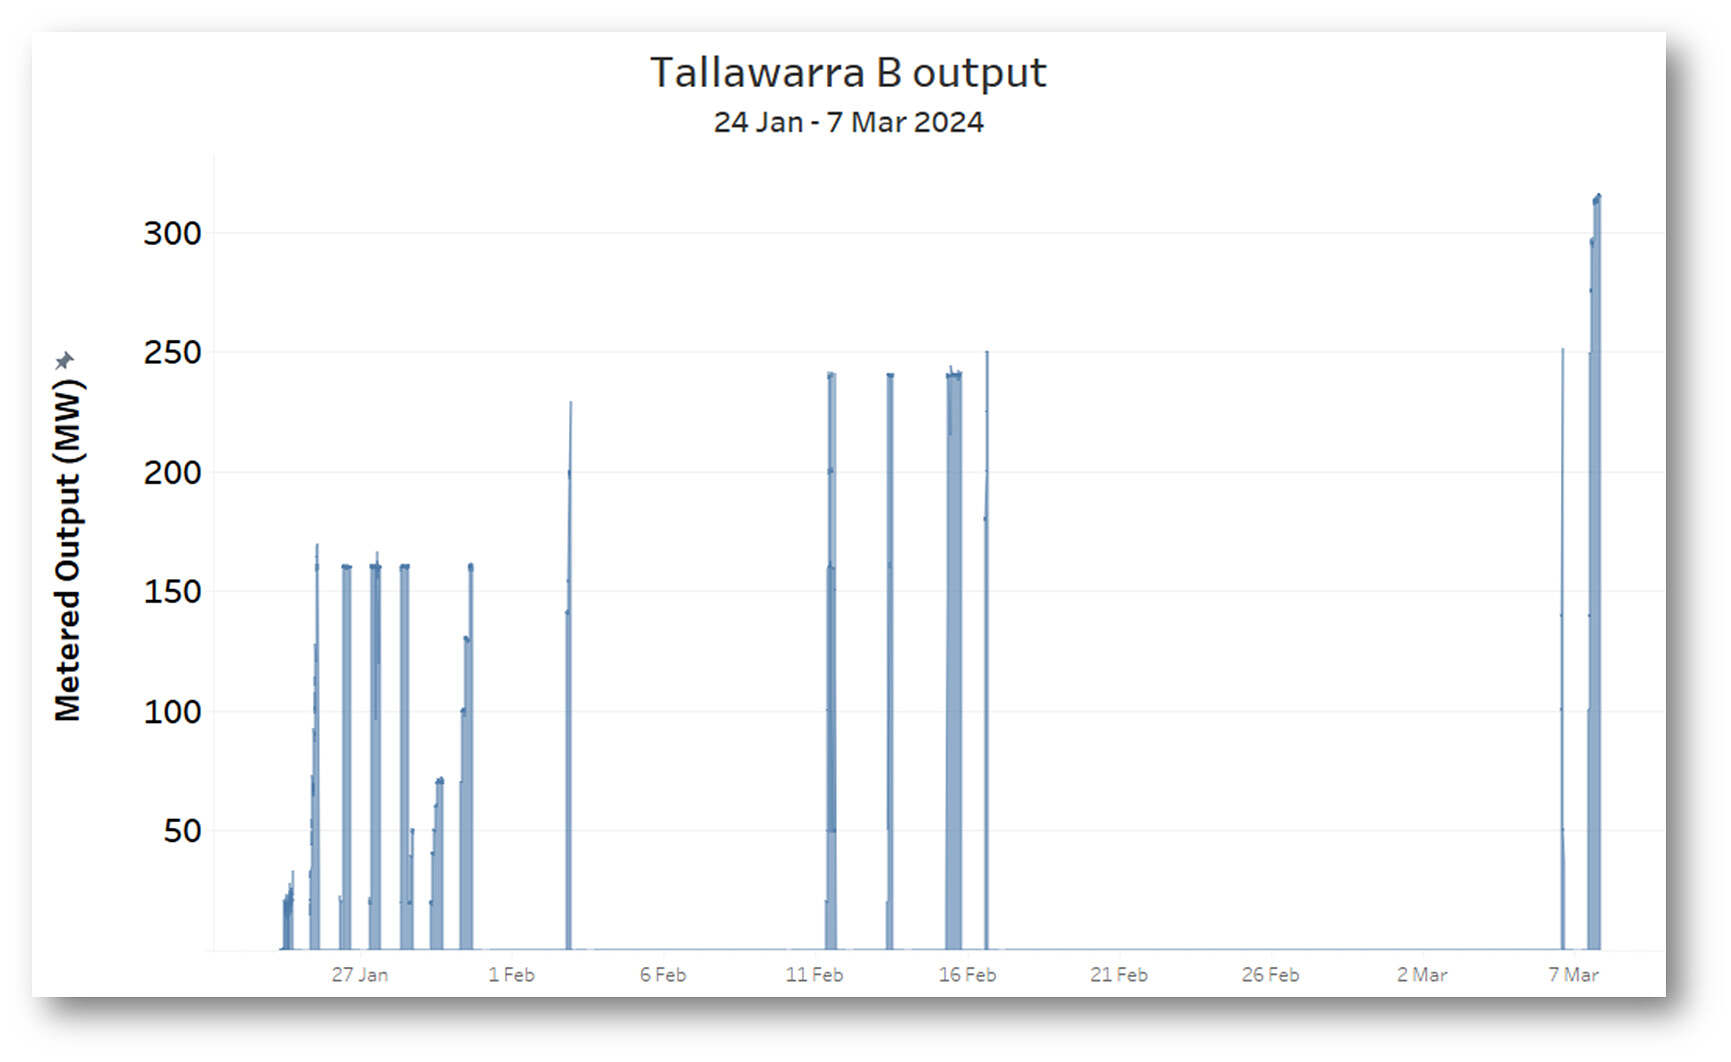
From the outside, the basic market data shows no obvious clues. Since the error in demand was only there if Tallawarra B was running, and directly proportional to the magnitude of its output, one idea might be to look for changes in NSW measured demand in dispatch intervals when Tallawarra B ramped up from zero output, or ramped down to zero at the end of a run. This might show demand apparently decreasing as Tallawarra B ramped up, or increasing at the end of a run. Here’s a plot of Tallawarra B output, NSW INITIALSUPPLY, and changes in each at dispatch interval granularity.
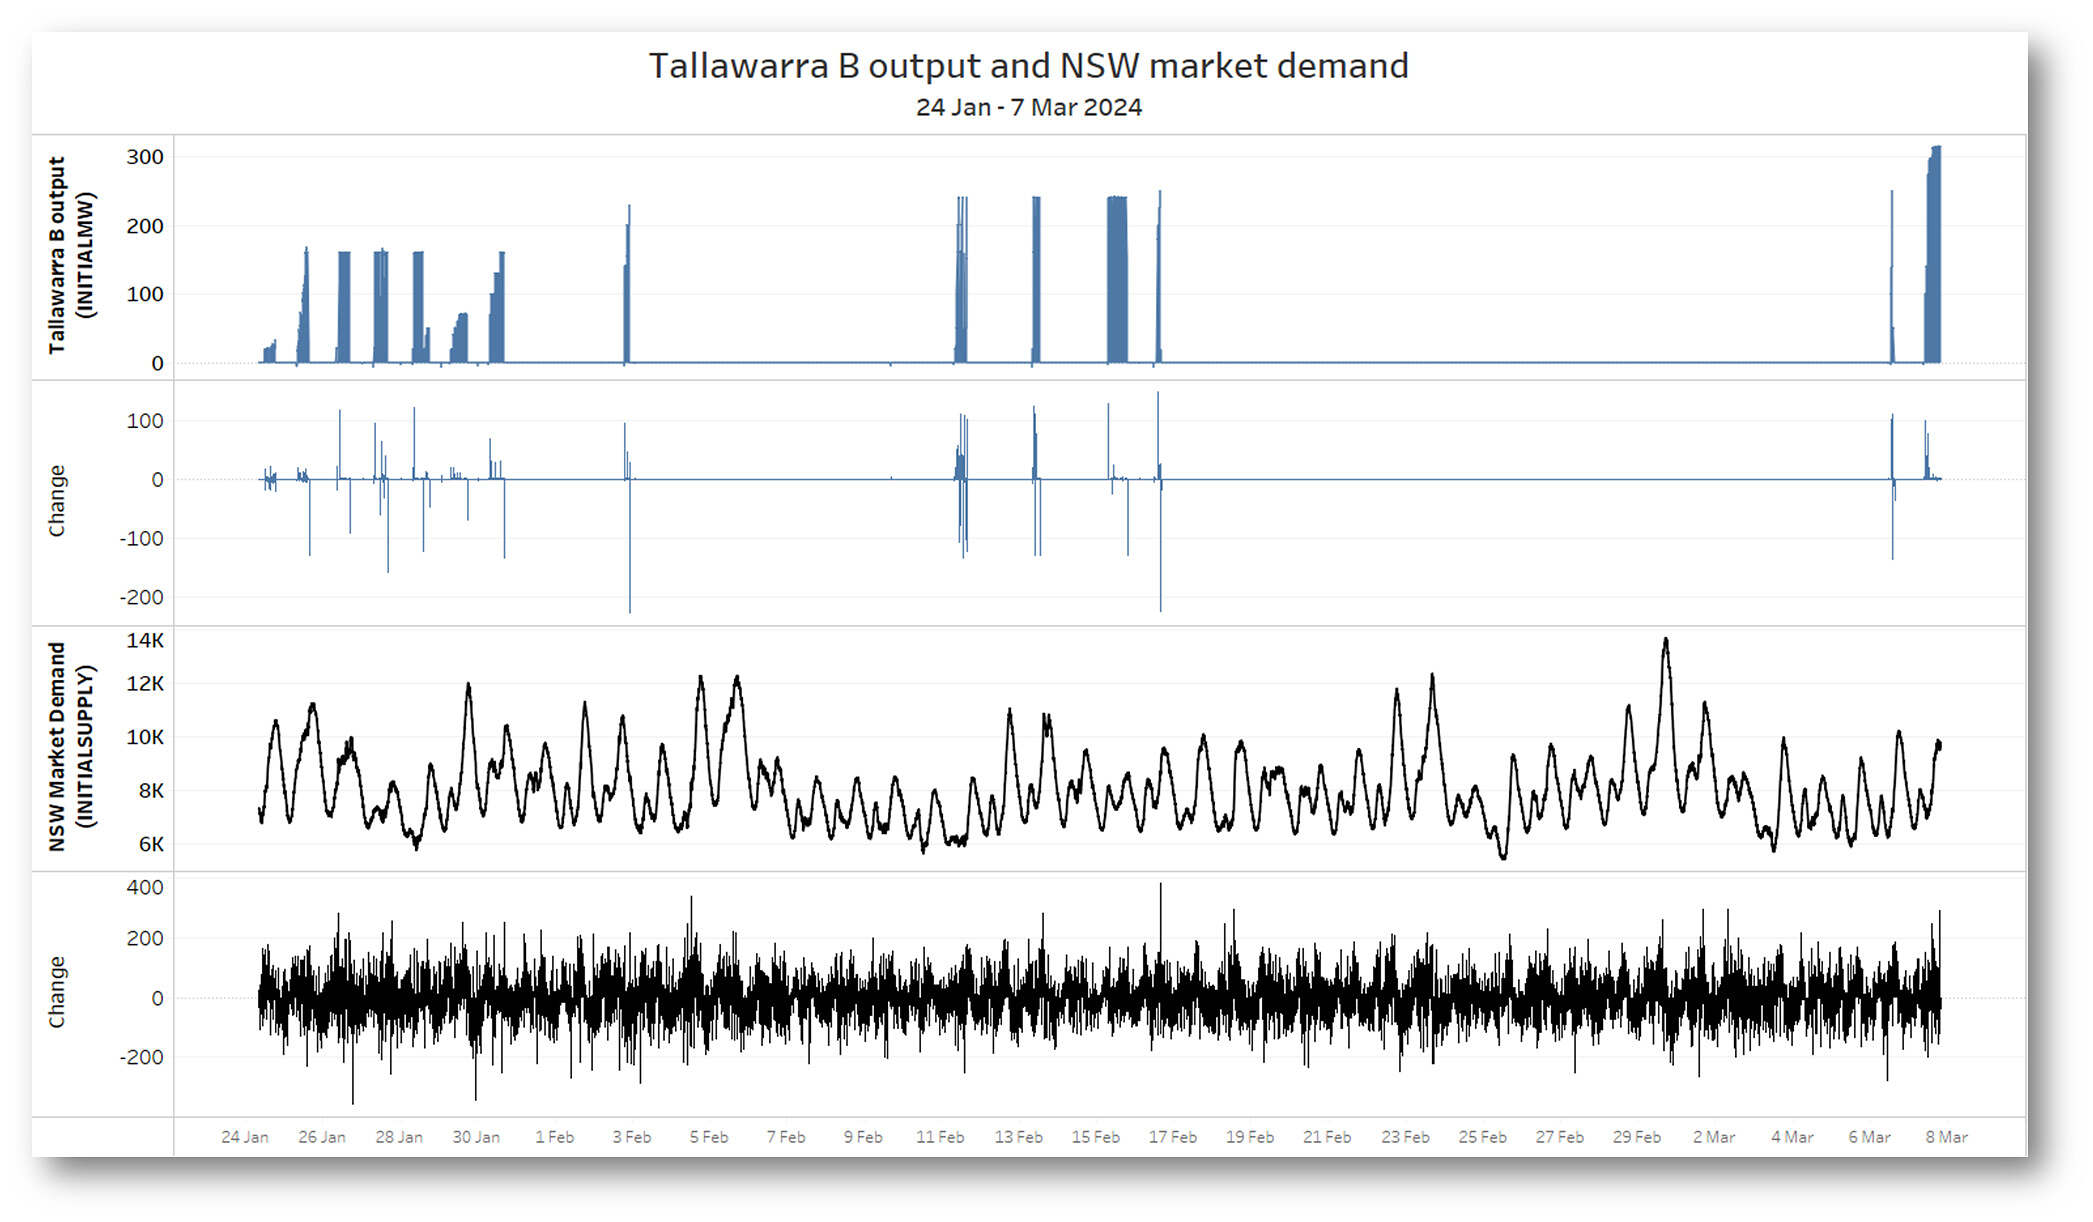
You’d be hard pressed to pick anything up from that, given the amount of “noise” in five-minute demand variation due to normal causes (such as real changes in demand 😉).
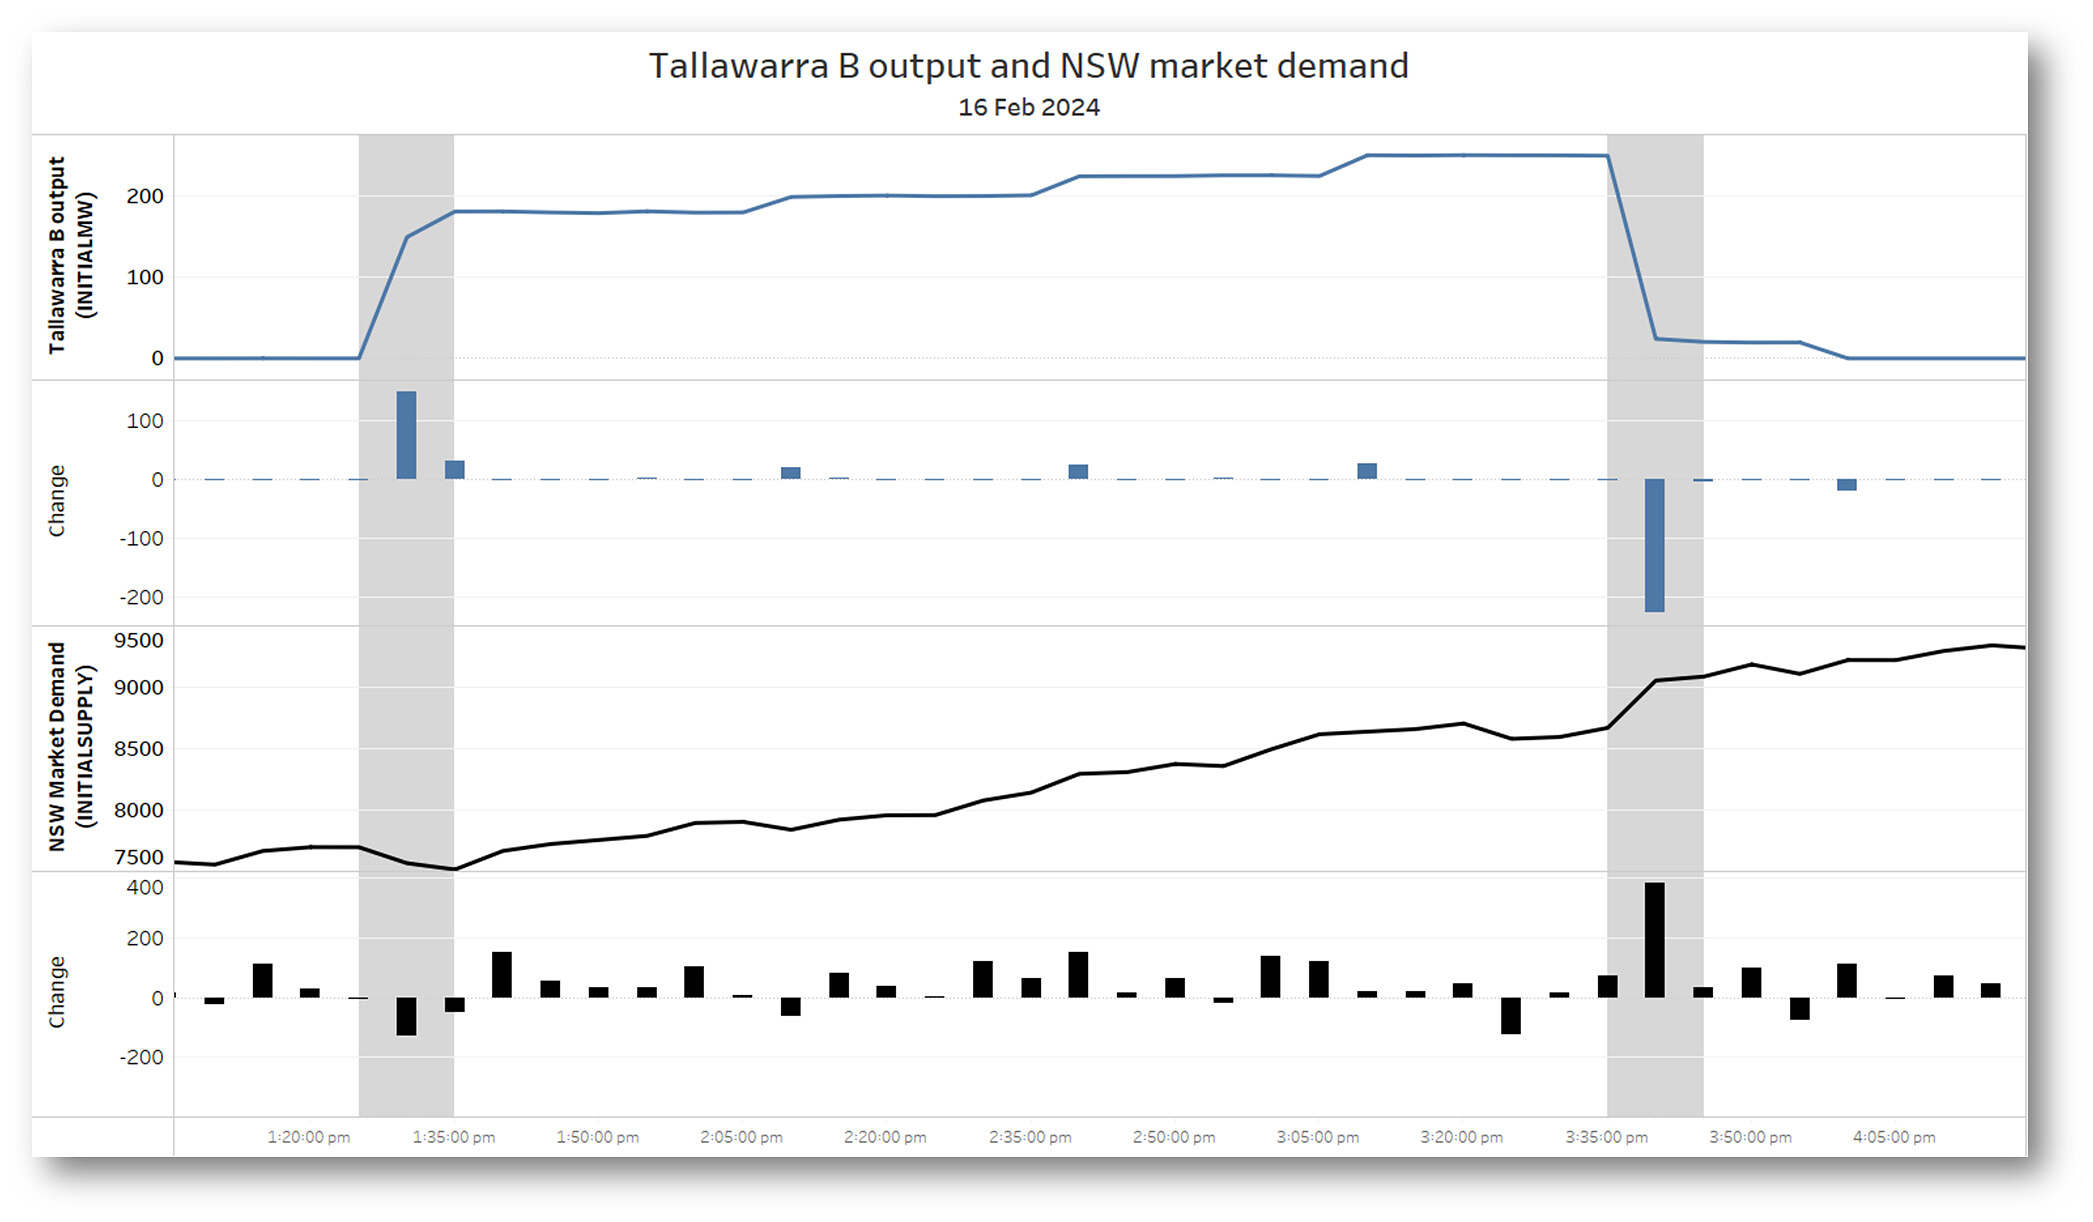
By squinting hard – at 16 February for example – some anti-correlation is apparent, but only in hindsight and certainly with no statistical significance:
Fixed – well, not quite: phantom generation
Once picked up, it would have been a straightforward fix to correct the bookkeeping issue and add Tallawarra B output into EMS measurement of NSW demand – one would think.
But apparently AEMO’s first attempt was NQR – as explained in these terms:
“From 1845 hrs on 07/03/2024 to 1920 hrs on 07/03/2024, a temporary fix corrected the NSW operational demand calculation, but incorrectly dispatched Tallawarra A when it was out of service, resulting in under-dispatch of the remaining NEM generation by approximately 275 MW”
This is somewhat cryptic and took a while to unpick: how could fixing the Tallawarra B issue lead to Tallawarra A – which wasn’t online and therefore couldn’t physically produce any output at all over the period AEMO specified – being “incorrectly dispatched”??
Here’s what the market data covering this period shows, summarised in ez2view’s Station Details widget for Tallawarra (A and B combined):
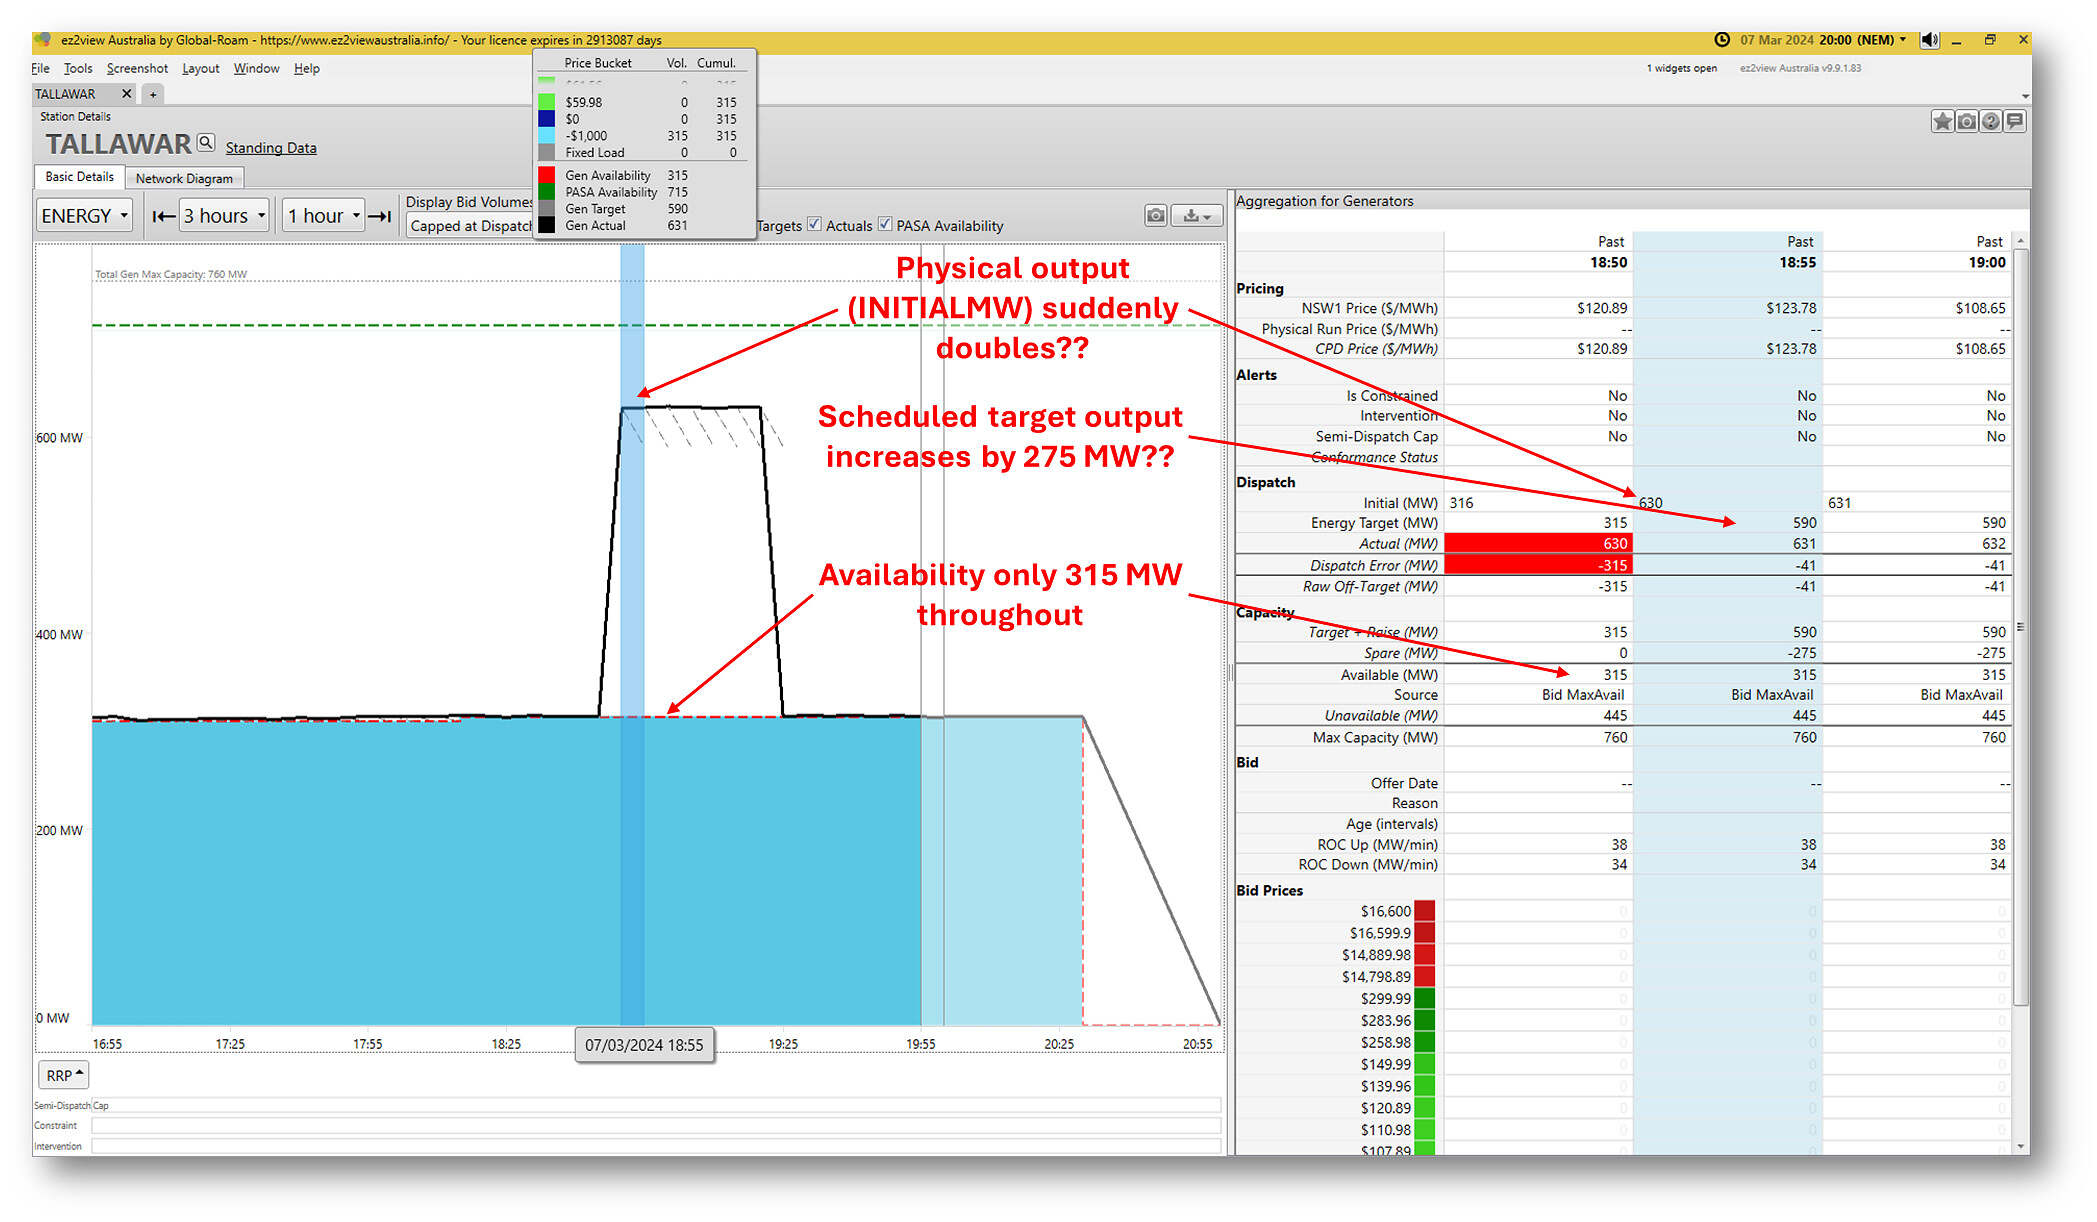
This shows an apparent output lift for the station from 316 MW (all Tallawarra B) at the beginning of the 18:50 dispatch interval (so measured just before 18:45, since dispatch intervals are labelled by their end time, and INITIALMW values are captured just before the start of the interval), to 630 MW five minutes later.
Drilling into the underlying unit-level data shows that the source of this additional output was Tallawarra A’s INITIALMW value jumping from 0 MW to 315 MW, despite the unit being offline and having offered zero availability throughout this particular day.
This was clearly not a genuine physical output reading from the offline Tallawarra A unit. What seems to have happened is a replication of Tallawarra B SCADA readings into the SCADA stream for Tallawarra A. Probably not the fix AEMO would have hoped for. Although we can see that at least there is a lift in measured NSW demand of about the right amount:
Why not twice the right amount though?? – if Tallawarra B output was now being added into NSW demand for the first time, and Tallawarra A output, already included in that measure, apparently increased by 315 MW, why didn’t measured demand lift by around 630 MW?? That remains slightly mysterious, not fully covered by AEMO’s notification.
The “phantom megawatts” from Tallawarra A continued to appear for another seven dispatch intervals – during which time AEMO presumably fielded some quizzical phone calls from Tallawarra’s operators.
A side-effect of these phantom SCADA readings for Tallawarra A is that NEMDE then dutifully scheduled that unit to ramp its (non-existent) output down at its maximum downward ramp rate, specified in Tallawarra A’s standing bids as 8 MW per minute, or 40 MW per dispatch interval. Even if a unit has offered zero availability, if it is (apparently) producing physical output at the start of a dispatch interval, NEMDE by design will not schedule the unit to ramp down any faster than allowed by its ramp rate offer.
So from 315 MW of phantom output at interval start, NEMDE instructed Tallawarra A to ramp down to 275 MW. But at the start of the next dispatch interval, apparent output from Tallawarra A was still 315 MW (again replicated from Tallawarra B SCADA) – rinse and repeat once more.
The side-effect of this side-effect is that the megawatts which NEMDE “thought” were being produced by Tallawarra A were not being scheduled from other generators actually online and available to produce them. So once again, the market would have ended up under-dispatched, with more work for frequency control mechanisms – and no doubt more stress for AEMO, who were fortunately able to correct this second glitch a lot more quickly than was the case for the original Tallawarra B oversight.
=================================================================================================
About our Guest Author
 |
Allan O’Neil has worked in Australia’s wholesale energy markets since their creation in the mid-1990’s, in trading, risk management, forecasting and analytical roles with major NEM electricity and gas retail and generation companies.
He is now an independent energy markets consultant, working with clients on projects across a spectrum of wholesale, retail, electricity and gas issues. You can view Allan’s LinkedIn profile here. Allan will be occasionally reviewing market events here on WattClarity Allan has also begun providing an on-site educational service covering how spot prices are set in the NEM, and other important aspects of the physical electricity market – further details here. |
Be the first to comment on "Missing megawatts and phantom generation"