We’ve noted that NSW is now in ‘Actual LOR2’ territory.
The NEM is a complex place, meaning that there’s (almost always) many factors* contributing to any given market outcome.
* for instance, it’s worth noting this subsequent article ‘Disallowed flow north on VIC1-NSW1 another significant factor in tight supply-demand in NSW + QLD’
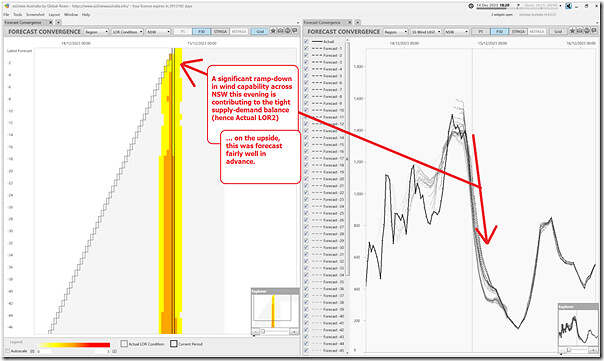
Worth flagging in this article that the rapid decline in aggregate wind farm contribution across NSW this evening is one of those contributing factors – as seen here in this snapshot of ‘Forecast Convergence’ in ez2view at the 18:20 dispatch interval (NEM time):
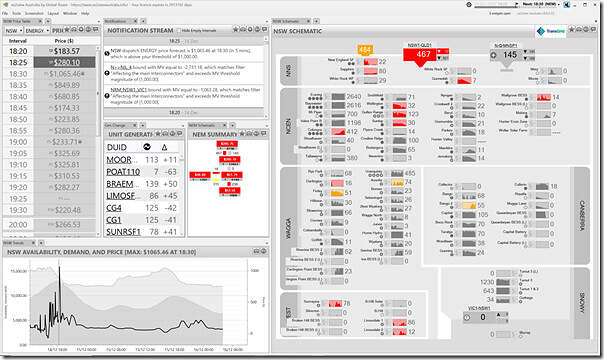
Note that the widget on the right shows UIGF (i.e. the Unconstrained Intermittent Generation Forecast) for Wind in NSW. Here’s a snapshot of the ‘NSW Schematic’ widget in ez2view at 18:25 (NEM time) so you can see who’s generating what:
A quick calculation offline shows that wind production (i.e. aggregate Final MW) has dropped from 1,463MW at 15:45 to be 918MW at 18:25.


Be the first to comment on "Wind production ramps down in NSW, coincident with Increased Demand (and then Actual LOR2)"