This is a quick record of an event early this morning that might be followed by others…
(A) Sequence of notifications
At 02:18 (NEM time) this morning, the AEMO published Market Notice 110339 as follows:
——————————————————————-
MARKET NOTICE
——————————————————————-
From : AEMO
To : NEMITWEB1
Creation Date : 21/10/2023 02:18:43
——————————————————————-
Notice ID : 110339
Notice Type ID : POWER SYSTEM EVENTS
Notice Type Description : Emergency events/conditions
Issue Date : 21/10/2023
External Reference : Non-credible contingency event – QLD region – 21/10/2023
——————————————————————-
Reason :
AEMO ELECTRICITY MARKET NOTICE.
Non-credible contingency event – QLD region – 21/10/2023
At 0133 hrs the Ross No 2 275kV Bus tripped.
AEMO did not instruct load shedding.
AEMO has not been advised of any disconnection of bulk electrical load.
The cause of this non credible contingency event is not known at this stage.
Manager NEM Real Time Operations
——————————————————————-
END OF REPORT
——————————————————————-
This was followed at 02:56 by MN110340 as follows:
——————————————————————-
MARKET NOTICE
——————————————————————-
From : AEMO
To : NEMITWEB1
Creation Date : 21/10/2023 02:56:51
——————————————————————-
Notice ID : 110340
Notice Type ID : POWER SYSTEM EVENTS
Notice Type Description : Emergency events/conditions
Issue Date : 21/10/2023
External Reference : Update Non-credible contingency event – QLD region – 21/10/2023
——————————————————————-
Reason :
AEMO ELECTRICITY MARKET NOTICE.
Update Non-credible contingency event – QLD region – 21/10/2023
Refer to market notice 110339.
At 0133 hrs the Ross No 2 275kV Bus tripped.
AEMO did not instruct load shedding.
AEMO has been advised of disconnection of 218 MW bulk electrical load.
The 132kV network between Clare South and Tully has been disconnected
The cause of this non credible contingency event is not known at this stage.
Manager NEM Real Time Operations
——————————————————————-
END OF REPORT
——————————————————————-
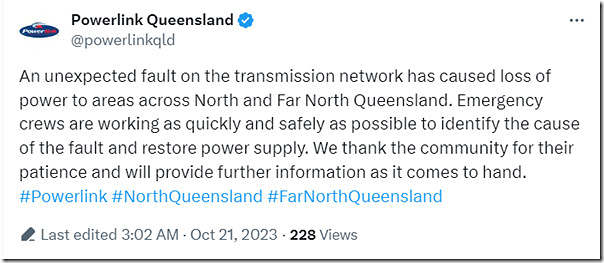
At 03:02, Powerlink Queensland tweeted this:
At 03:40 the AEMO published MN 110341 as follows:
——————————————————————-
MARKET NOTICE
——————————————————————-
From : AEMO
To : NEMITWEB1
Creation Date : 21/10/2023 03:40:53
——————————————————————-
Notice ID : 110341
Notice Type ID : POWER SYSTEM EVENTS
Notice Type Description : Emergency events/conditions
Issue Date : 21/10/2023
External Reference : Update – Non-credible contingency event – QLD region – 21/10/2023
——————————————————————-
Reason :
AEMO ELECTRICITY MARKET NOTICE.
Update – Non-credible contingency event – QLD region – 21/10/2023
Refer AEMO Electricity Market Notice 110340
At 0208 hrs the Ross No 2 275kV Bus was returned to service.
The cause of this non-credible contingency event has been identified and AEMO is satisfied that another occurrence of this event is unlikely under the current circumstances.
AEMO will not reclassify this event as a credible contingency event.
Manager NEM Real Time Operations
——————————————————————-
END OF REPORT
——————————————————————-
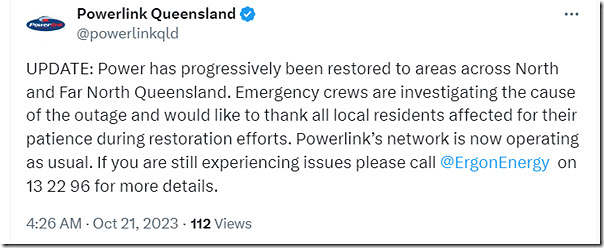
At 04:26 Powerlink followed with this tweet:
I’ve not seen anything since that time in a quick review (later) Saturday morning … and have published this article at ~10:55:
(B) What was visible in our software
I wondered what was visible (including whether we could see where the ~200MW of load was lost), and so referred to our ez2view software to see.
B1) Snapshot at 01:50
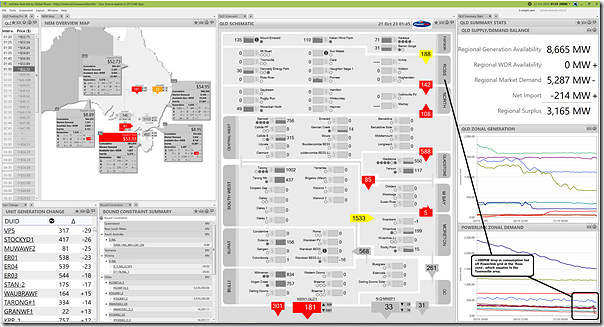
Here’s a collage of a few widgets in ez2view time-travelled back to the 01:50 dispatch interval … so with data published at ~01:45:20 by the AEMO following the trip of the Ross No 2 275kV Bus near Townsville:
Note that the chart in the bottom right trends Zonal consumption data Powerlink publishes as part of its ‘QData’ data package that is an optional extra in client’s ez2view subscription, with the zones matching the zones Powerlink commonly refers to in its planning documents, like the Annual Planning Report.
Highlighted is significant (~200MW) drop in consumption in the Ross zone:
(a) at 01:30 it had been metered at 248MW
(b) before spiking to 324MW metered at 01:40 (perhaps because of rearrangement of flows with the loss of the Ross 275kV bus at 01:33)
(c) then dropped to 78MW at 1:45 …
(d) … and fell further (e.g. to 34MW at 02:40)
The Ross zone equates to the Townsville area … and, given the time of day when this happens, I would think the majority of the load being consumed at the time (and so interrupted) would have been at several large industrial energy users in the area – including Glencore’s Copper Refineries (in the news this week coincident with the closure announcement for the copper mine at Mt Isa) and the Sun Metals zinc smelter.
There may have been losses in other zones, but (if so) the scale was smaller and difficult to quickly see on the chart.
B2) Snapshot at 04:50
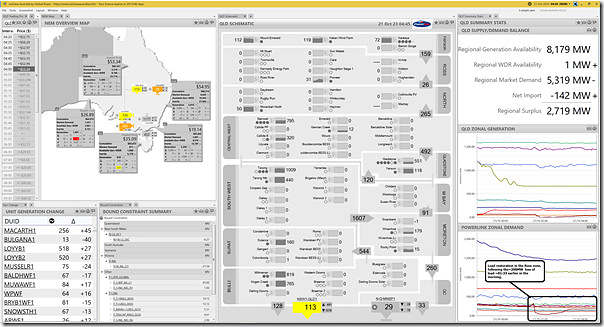
Winding the clock forward 3 hours (i.e. to 04:50 … so almost half an hour after the second Powerlink tweet above where they say ‘Power has progressively been restored to areas across North and Far North Queensland.’) we see the following:
We see consumption in the Ross zone has risen back up:
(a) to ~180MW by 03:35
(b) and fairly steady through to the (04:50) time of the snapshot
(c) so not quite back to the levels seen at 01:30 before the incident.
Nothing further, at this point…


“Around Townsville” lol you mean almost the entire of NQ, it went all the way out to Julia Creek, Cloncurry, south to Collinsville in the Whitsundays. It is a major city so not all of consumption would have been major industrial users. Either way it was really a non event, had it happened during AM or PM peak hour then possibly it could have been different.