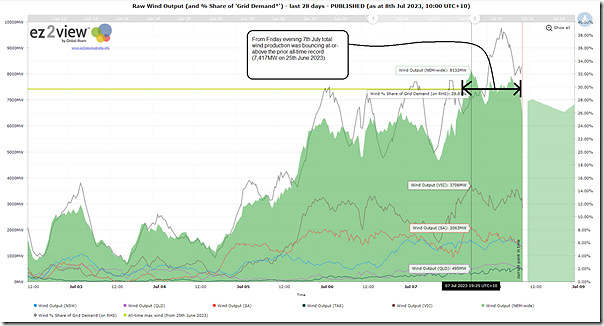
We’d speculated about the possibility earlier in week, and it truly came to pass early on Friday evening 7th July 2023, as shown in this zoomed snippet from the pre-configured 28-day view for NEM-wide wind production from ez2view online here:
The forecasts were that the new peak would be in the early hours of Saturday morning … but the chart above show2:
1) the new highest point to be 19:20 Friday 7th July evening (i.e. InitialMW for the dispatch interval ending 19:25).
2) At the level of 8,132MW … which was 715 MW higher than the recently set (and now superseded) all-time maximum of 7,417MW from 25th June 2023.
(A) How much higher could it have been without curtailment?
Would need to use ‘next day public’ data available from tomorrow (i.e. Sunday 9th July) to see if this morning’s yield could have been higher still (except for curtailment).
Towards the end of Q2 (on 24th June) we’d belatedly shared some results about curtailment from GenInsights Quarterly Updates for the earlier Q1 2023 in noting about ‘increasing curtailment of wind and solar across the NEM’. This next few weeks we’ll be crunching numbers again for the next quarterly instalment (for Q2 2023) so are keen to see how these patterns are developing.
(B) Longer term trend of wind harvest
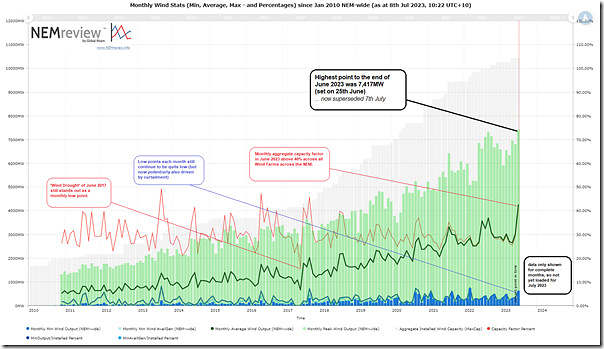
Opening up our longer-term trend of monthly wind production patterns developed for NEMreview v7,
(those with a licence to the software can open their own copy here).
This does not yet contain any data for (the incomplete month of) July 2023 – but is still useful for highlighting the trend in growth in wind capacity and peak/average/minimum output.


This is great news but what is the implication? One thing that sticks out is that total NEM wind gen was well under 1 GW on Monday. Which is a +7.5 GW variance within 5 days. Relatively speaking, that is the equivalent of saying that we lost 2.5 Eraring stations on Monday. What does that mean for system security? There’s all this fanfare for difficult to predict peak wind days, but no mention of times when wind gen is miniscule (which happened five days earlier).
The sub-1 GW wind gen on Monday was at its worst during the evening shoulder period where there is no solar and rapidly rising demand resulting in a measly 15% wind contribution to the NEM. The rest of the supply coming from coal, hydro and gas.
The interesting metric isn’t the absolute maximum of minimum but the % of the nameplate. The min % is far more important than the max. The recent Net Zero Australia plan reckons we need 400-500 GW of wind+solar to power what is just a 25 GW system (+ reserves). That’s a 16 to 1 overbuild ratio.
Generator profits are a combination of quantity and price. Recently truck loads of avocados were found at the local dump as there was no market. People were outraged. However, there were simply too many avocados at that point of time. It would most useful to have the price when wind output was 1 GW compared to when the output was over 8 GW last Friday evening. How many wind farms have a Power Purchase Agreement and how many have a PPA for the expected life of the wind farm?
Don’t forget most of the more recent wind farm builds were motivated by the old RET and the associated penalties for retailers. Business case for the development was driven by this – energy value was almost a bonus. Not normal PPAs as we would know them.