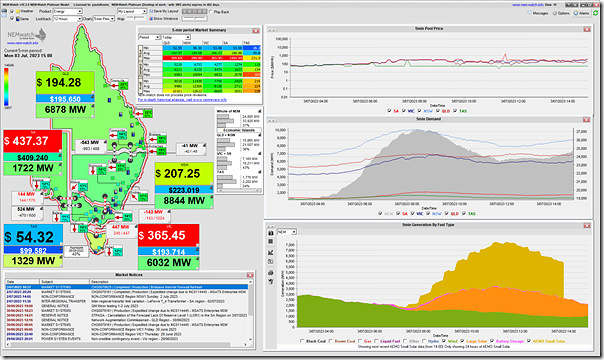
A quick article with this snapshot from NEMwatch at 15:00 on Monday 3rd July 2023 highlighting mainland spot prices elevated in all 4 regions (but highest in SA) coincident with modest output from both VRE sources (wind and solar):
(A) Modest wind output
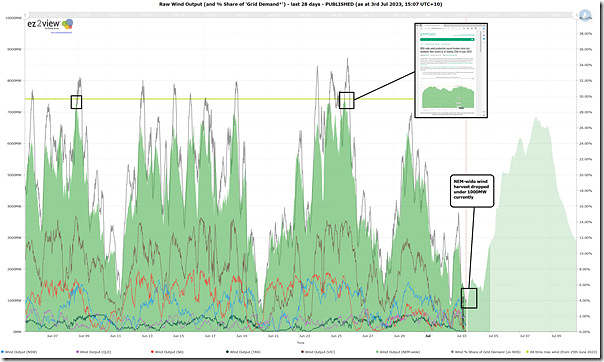
Last week Dan wrote about the gusty winds on Sunday 25th June 2023 that contributed to a new all-time record. The following snapshot comes from the same pre-prepared ez2view online trend chart that we’ve published for our internal use in the online Dashboards resource:
It highlights how we’ve dropped below 1,000MW of aggregate wind harvest currently (which means, when compared against the 10,426MW of installed capacity (remembering these caveats) an instantaneous capacity factor of under 10%).
(B) Modest solar output
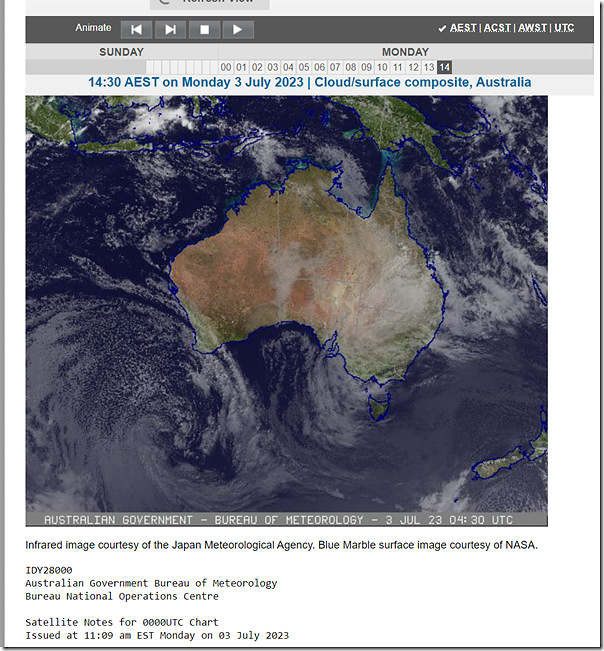
Here’s a snapshot of the BOM Satellite image (at 14:30 today) showing the widespread cloud band that is affecting solar resource across much of the NEM:
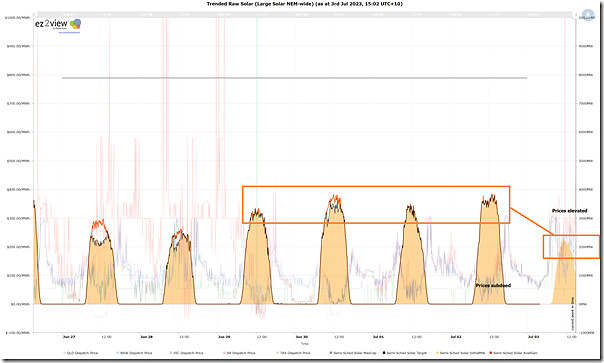
The following snapshot is of a pre-prepared ez2view online trend chart that we’ve published for our internal use in the online Dashboards resource:
It is focused on aggregate production levels from all Large Solar units across the NEM, highlighting that production level today is 33% to 50% lower than it has been in the past couple days.


Leave a comment