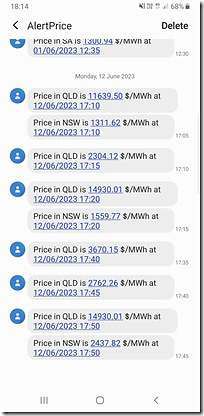
With Kogan Creek and Millmerran 2 out of action (amongst other factors) it was less of a surprise to see price volatility in the QLD and NSW region this evening, as shown in this string of SMS alerts from our ez2view software:
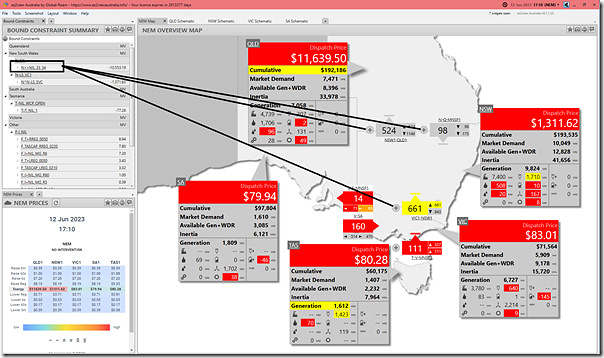
The prices above $1,000/MWh began in the 17:10 dispatch interval – as shown in more detail in this snapshot of the ‘NEM Map’ widget in ez2view time-travelled back to 17:10:
As with most dispatch (and price) outcomes in the NEM, there are typically always more than just one single factor.
(A) Bound transmission constraint
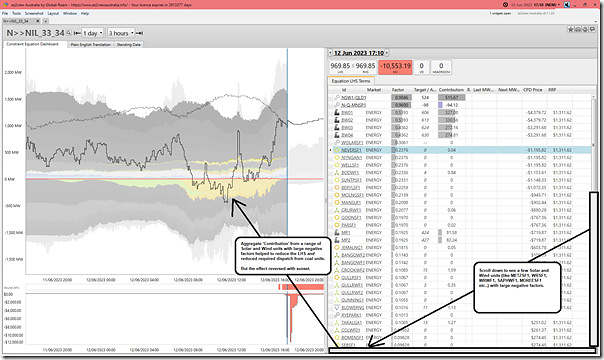
Highlighted on the image above is the bound ‘N>>NIL_33_34’ constraint equation, which is shown in more detail here via the ‘Constraint Dashboard’ widget:
This constraint equation (as highlighted above) impacts on QLD1-NSW1 and Directlink interconnectors … but also on VIC1-NSW1 interconnector as well. With that bound, lower prices in VIC can’t participate further in the NSW and QLD pricing action.
We also can see that:
1) Prior to sunset, there is a non-negligible aggregate contribution from a handful of solar and wind units with a high negative factor:
(a) We see this in the trended yellow and green shape under the y-axis on the chart)
(b) This helps to pull the aggregate LHS down.
2) However come sunset this effect disappears:
(a) leading to a requirement for the dispatch of other replacement energy (plus more because of rising demand) – which adds to the LHS
(b) this coincides with the RHS reducing
(c) and so contributes to the constraint binding.
(B) More to come…?
Time permitting, will post more…


Leave a comment