Early Saturday evening 12th November, South Australia was islanded* from the rest of the NEM as a result of storms that damaged (one or more?) transmission towers on the Heywood flow path.
It seems likely that the frequency island will continue at least until Friday evening 18th November (with ElectraNet gaining first real sight of the damage this morning it may be that this return to service expectation is adjusted).
* for the pedantic reader, note that the Murraylink interconnector is still operating, but it is a DC interconnector so there’s a limit to the benefit it can supply to South Australia.
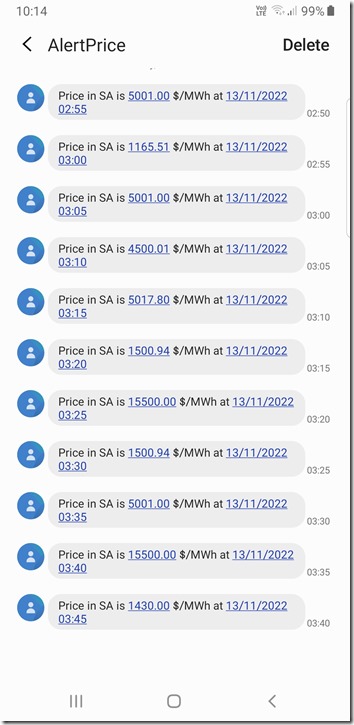
I awoke this morning with a significant number of messages – many automated alerts (like the SMS-based high price alerts in South Australia overnight shown below) and quite a number of messages in various forms from keen WattClarity readers (thanks for all of those!). This is my third article already today, chipping my way through a number of them, plus exploring the day as it unfolds.
(A) Price volatility early this morning
From 02:55 to 03:45 this morning (NEM time) the South Australian region saw dispatch prices for ENERGY well above $1,000/MWh, as shown in this record of the SMS messages:
It’s really not a surprise that this type of thing would happen, given the circumstances….
(B) Bidding behaviour over the period
… but I thought I’d take the opportunity now (given these spikes were before the 04:00 end of the prior market day, so ‘Next Day Public’ data like bids is already available) to take a quick look at bidding behaviour – using the ‘Bids & Offers’ widget inside of my copy of ez2view.
Our interest is growing (through analysis in GRC2018 and GenInsights21 and now into GenInsights Quarterly Update) in the tensions between the two general types of services we see being encouraged increasingly separately:
1) There’s the ‘Anytime/Anywhere Energy’ that’s being encouraged by the form of support for VRE in the NEM; and
2) There’s the residual ‘Keeping the Lights on Services’ that is providing all sorts of balancing (and ‘keeping the lights on’) services.
So we thought we’d look at these separately … to the extend that they bid:
(B1) Bids for Wind and Large Solar units
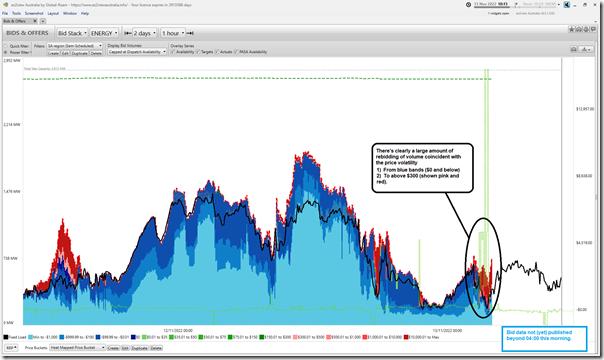
In the first image we have filtered down to bids for just the Semi-Scheduled units in South Australia (noting this includes those who are Non-Scheduled but operating like Semi-Scheduled following relatively recent instruction from the AEMO):
In this image we can clearly see two things:
1) Even accounting for the fact that this covers a 48 hour period, including sunshine hours (i.e. when the 4 x Large Solar units in South Australia would also be contributing) the aggregate availability for wind during the early hours of this morning was quite low;
2) Coupled with this we see a fair amount of repricing of capacity up to higher price bands … which would seem to have been at least one contributor to the high prices shown at the same time (in the dotted green lines).
Cue the frothy outraged (and perhaps outrageous) social media commentary about those greedy, price-gouging wind farm operators?
… I would hope not.
There is quite likely to be reasonable explanations for this repricing of capacity:
1) I’ve not looked, but I wonder whether some of it would have been due to a desire to manage high FCAS costs for Contingency Raise :
(a) Which I presume would have been the case in an overnight period with South Australia islanded; and
(b) Which are shared between all generators producing at the time.
2) There may well be other reasons as well.
Pity we’re not so circumspect before jumping in quickly to blame those greedy, price-gouging fossil-fuelled generators…
(B2) Bids for Dispatchable units … including Negawatts
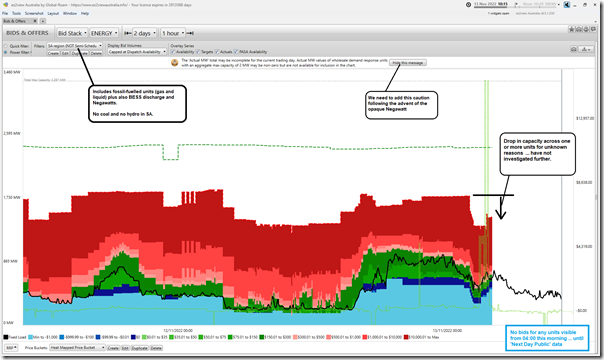
On the other side of the coin, here’s the trended bid stack for all dispatchable units in the South Australian region:
This includes thermal units (gas and liquid fuelled in SA – no coal), batteries and negawatts … noting that there is no hydro in that region (at least for now). The warning message at the top of the chart has been added there to help users, courtesy of Tripwire #3.
I’ve highlighted a drop in available generation bid into the market in the early hours of the morning, coincident with the price spike. However eyeballing back 48 hours this seems not dissimilar to what happened 24 hours and 48 hours beforehand. Indeed, there’s probably more capacity bid in blue and green than there was at the same time early Friday morning.
(B3) All units (that bid), all together
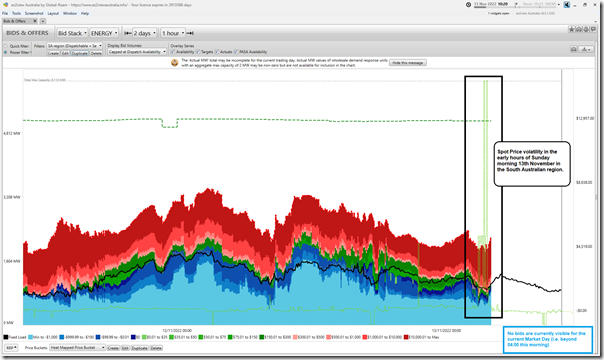
Excluding the variety of invisible units, here’s the aggregate stack of supply options over the two day period:
We’ll be interested to see how this pattern unfolds over the coming days … out until Friday 18th November, or whenever the network is repaired and back in service.
(C) This does not look at FCAS prices!
To hopefully ensure all readers are aware – the above is only part of the picture, as it only deals with one commodity (ENERGY) out of 9 in total.
We already saw yesterday that FCAS prices were elevated yesterday evening … I have not looked further.


Hi Paul,
Your comment “the Murraylink interconnector is still operating, but it is a DC interconnector so there’s a limit to the benefit it can supply to South Australia”
Why is a DC interconnector limited benefit?? Any reference would be appreciated.
Thanks
A DC connector can not provide frequency control services. It could provide some MWs, but otherwise SA’s frequency was completely separated from the rest of the NEM, same way Tasmania’s frequency is always separate. Tasmania’s grid is already more unstable than the NEMs.
Don’t have any references, just my guess.