AEMO put all regions of the NEM into Market Suspension on Wednesday 15 June 2022 at 1405, which we noted on WattClarity at the time. AEMO provides a detailed guide to Market Suspension on its website.
In this article I’ll use our ez2view software to illustrate how the settlement prices are set during this period, and make a few comments on how dispatch is working. There’s a whole separate topic about compensation for generators that incur losses when running at market suspension prices that we won’t look at here.
What’s being paid?
AEMO uses the Market Suspension Pricing Schedule in determining settlement prices, also applying some inter-regional adjustments. AEMO publishes this schedule each week, 14 days in advance, on NemWeb and in the EMMS database. AEMO’s methodology describes how this is done.
In short, the week’s half-hourly regional prices in the schedule for each market (energy and the 8 FCAS services) are calculated from a 28-day average of historical prices.
1) There’s a separate set for business days and non-business days.
2) Prices are capped (regardless of whether administered pricing is in place) at the Administered Price Cap, which is currently $300/MWh.
Using a 28-day historical average raises an interesting question of what happens if the market suspension is in place for more than four weeks, as the historical prices used would then be based on previous market suspension schedules (plus the inter-regional adjustments), not spot market outcomes.
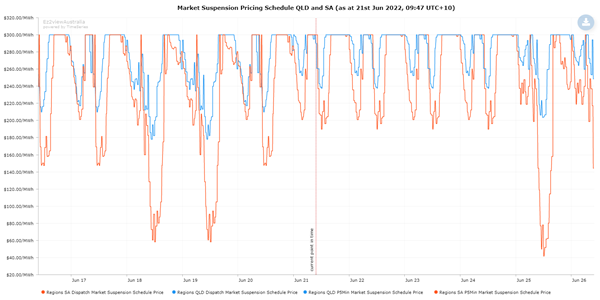
In the Trend Editor widget in ez2view and in NemReview we’ve added a new data series that displays the market suspension pricing schedule. We’ve taken a shortcut in the handling of the non-business days, as there isn’t a simple table in the EMMS of which days are considered public holidays in “the majority of that region” as defined in the methodology – we’ve just said for now (to be later tightened up) that weekends are non-business days.
1) Given the very high prices in the last few weeks it’s no surprise that there are a lot of $300 prices here.
2) Renewable generators in QLD and SA can note that there are no negative prices in the date range shown here.
Unfortunately this doesn’t quite give us perfect foresight of the next 2 weeks’ prices. It’s not as simple as looking up the applicable schedule (schedule effective date, region, market, business/non-business day and half-hour period).
To minimise “the accrual of negative inter-regional settlement residues”, AEMO “must cap spot prices in regions upstream of a suspended region in accordance with NER clause 3.14.5(f)”.
This is best illustrated with an example, using the NEM Prices widget in ez2view.
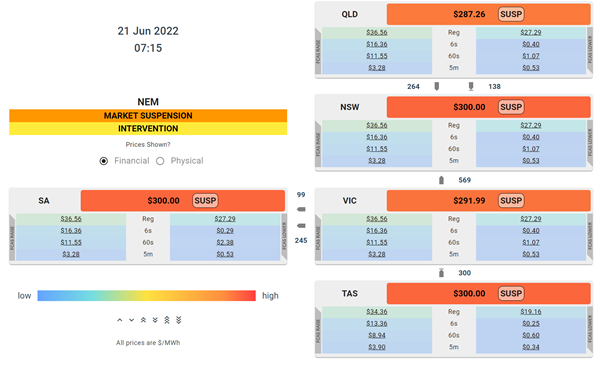
At 07:15 on 21 June 2022, the market suspension schedule has $300 as the energy price for all regions. To apply clause 3.14.5(f) above, we need to find the regions flowing towards a suspended node. All of the regions are suspended, so that’s easy.
1) QLD is flowing into NSW, and VIC into NSW and SA, so we expect to see a small discount to $300 (the NSW price, here the relevant “suspension node” in 3.14.5(f)), which is what we see.
2) What about TAS? It’s flowing into VIC but isn’t discounted. That’s because Basslink is not a “regulated interconnector” – it can in theory bid itself out of the market if it wanted to at any time including when there are counter-price flows.
I wanted to show a more detailed example here comparing two intervals with large and small flows to show the impact of the different loss factors on the adjusted prices, but instead found I couldn’t explain the outcomes so have asked AEMO for clarification. I’ll write more in a later article once I understand more of the detail. These are complex and unprecedented times.
What’s happening in dispatch?
AEMO’s still running the bidding and dispatch process to manage the physical dispatch of the market, as it is able to do under market suspension if practical and reasonably possible. AEMO is issuing numerous directions (both on and off) to manage the level of thermal and hydro capacity that is running and to manage the flows on BassLink.
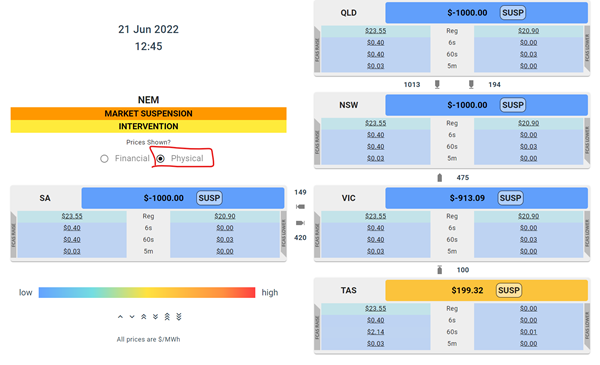
On several days in the last week, particularly during high wind and solar generation, we’ve noted physical dispatch prices going to the market price floor of –$1000. Most of the wind and solar generation is bid to the floor and not under direction, so physical dispatch prices of –$1000 result in curtailment allocated using the tie-breaking principle, as discussed in a recent WattClarity article. We might look into the scale and distribution of this curtailment in a later article.
1) In ez2view the NEM Prices widget has a switch to show the physical price in dispatch – see below an example where physical prices were low across the mainland, likely curtailing oversupply of wind and solar.
2) We’re showing here the ROP (not RRP) value from the INTERVENTION=1 run, as the RRP is overwritten with the price calculated under market suspension.
AEMO’s published P5 and P30 pre-dispatch forecasts reflect what’s going on in the dispatch solution, not what’s in the market suspension pricing schedule, meaning they give an indication of how the market’s clearing but no information on what the settlement prices will be.
As intervention pricing is active for much of the time at the moment given the number of directions AEMO is issuing, there are often two sets of prices published in the relevant predispatch price tables in the MMS, with the INTERVENTION=1 price the relevant price to see the physical dispatch.
We don’t currently show the physical prices for P5 and P30 pre-dispatch forecasts in ez2view.


Be the first to comment on "Pricing and dispatch during market suspension"