This morning I awoke to another weather alert for ‘strong winds’ … and there were also news reports of localised power outages* in northern NSW as a result of the same ‘Antarctic blast’ weather pattern.
* speaking of these power outages, this afternoon I’ve seen Tim Ryan’s note on LinkedIn here that provides a very busy map of what’s happened in northern NSW
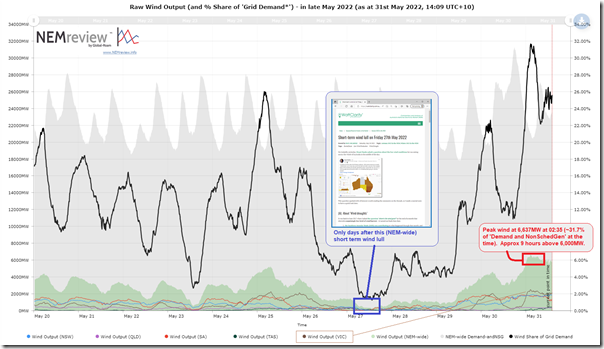
So I opened up this trend query in NEMreview v7 to investigate what was the aggregate production level across the NEM:
The headline result was a peak production early this morning (InitialMW for 02:35 Tuesday 31st May … which means FinalMW (i.e. metered) at 02:30) where the level reached 6,637MW.
A quick check that this ‘blows away’ (pardon the pun) the previous high point of 6,428MW on Sunday 25th July 2021.
A couple points to note here:
1) I recall posting about the ‘Yin and Yang of Wind’ back in September 2015 and there’s a perfect illustration of this in the chart above, with the new maximum point on Tuesday 31st May coming only only four days after this ‘short term wind lull on Friday 27th May’!
2) We all know how ‘Underlying Demand’ is lower in the early hours of the morning – and this carries through to ‘Grid Demand’ as well, but it’s worth noting that this wind production represented approximately* 32% of Grid Demand at the time:
Note that AEMO more typically uses ‘Operational Demand’ as the measure for ‘Grid Demand’, but that data is only published on a 30-minute timestep, so can’t be
3) The record NEM-wide was driven with VIC wind production the largest share (above 2,000MW) – closely followed by SA and NSW neck-and-neck just below 2,000MW, with QLD a long way behind and TAS brining up the rear (in this case).
—
Given winter is typically the windy period (as evidenced by last year’s consecutive run through the record high points) we’ll wait to see how this progresses when we formally tick into winter tomorrow morning…
—
PS on 4th June 2022
It’s only when posting this longer-term trend of monthly wind stats a couple days later that I note I posted the above too soon … in that the wind really cranked that same afternoon:
1) reaching the the even higher level of 6,853MW metered at 16:40 (i.e. Initial MW for 16:45 means metered Final MW at 16:40).
2) as per the above, it was the Victorian region that contributed the largest share


Leave a comment