As I noted here, I can’t be in Sydney this week for the Smart Energy Council’s ‘Smart Energy Conference and Exhibition 2021’ (though some of the Overwatch Energy team are there, I understand) – but I could not miss seeing that the market provided some fireworks this evening across all 4 mainland regions, coincident with nature putting on its own lightning show this evening in Brisbane.
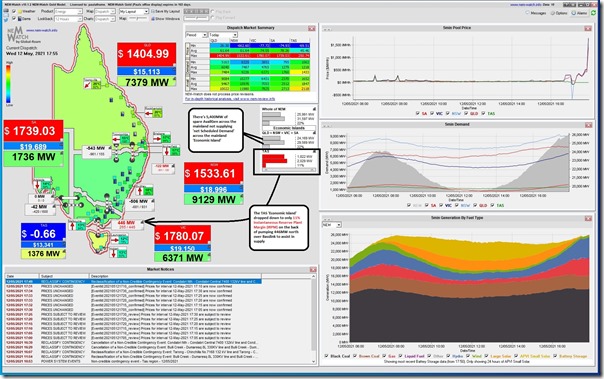
Here’s a snapshot from NEMwatch v10 showing the first instance of prices above $1,000/MWh at 17:55 today:
I don’t have much time this evening, so just a few quick points:
(A) Pattern of Dispatch Prices
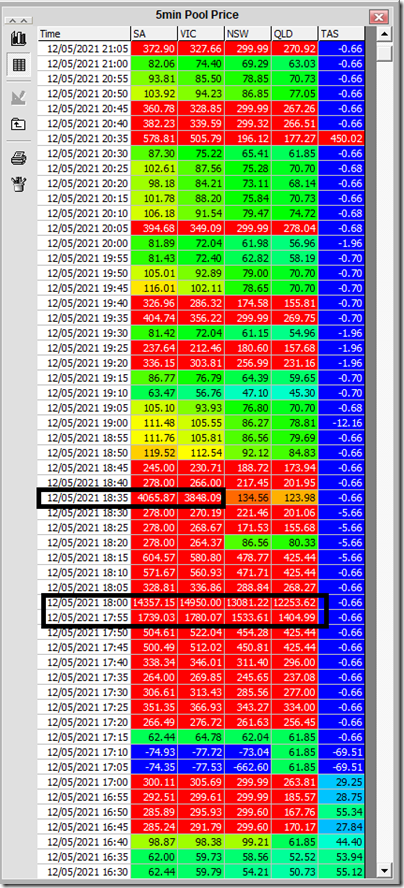
With the benefit of NEMwatch again, here’s the pattern of dispatch prices from 16:40 through until 21:05 this evening:
I’ve highlighted the prices above $1,000/MWh:
1) In the 17:55 dispatch interval (snapshot from NEMwatch above).
2) In the 18:00 dispatch interval (prices up near the Market Price Cap); and
3) In the 18:35 dispatch interval, starting the 19:00 trading period – but just for VIC and SA.
—-
In the NEMwatch snapshot above from 17:55 we’ve annotated how there was 5,400MW of spare ‘Available Generation’ surplus to what was being required as ‘Total Demand’ across the mainland, net of imports from TAS. This seems a lot. Because of lack of time, I’ll focus in on the VIC region because it was one of the two that experienced the most extreme pricing.
(B) This was forecast in advance
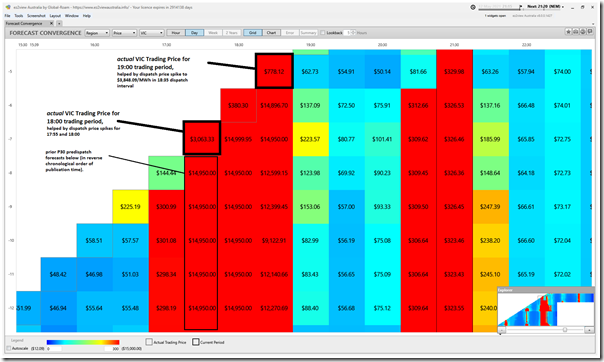
Without going into too much detail, this snapshot from the ‘Forecast Convergence’ widget in ez2view shows that the price spikes in VIC were forecast in advance:
More specifically, the strength and duration of what was forecast turned out to be significantly stronger than what happened in reality.
(C) Available supplies were tight in VIC
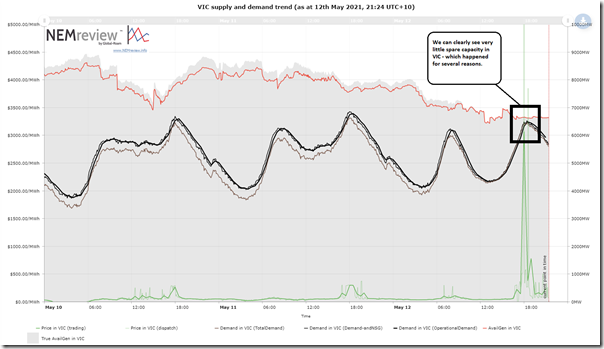
Here’s a quick trend from NEMreview v7 that shows the situation just for Victoria that shows that the level of demand and available supply were very similar at the time of the spike:
Don’t forget that VIC was importing from TAS (and SA and NSW) at the time – but it does go to point to some of the factors involved. In particular, see how ‘Available Generation’ declined significantly through the 48 hour period to the time of the spike (i.e. reducing by ~2,000MW – of which ~1,300MW reduction was in the past 24 hours). There are several reasons for this, including:
(C1) Coal unit outages
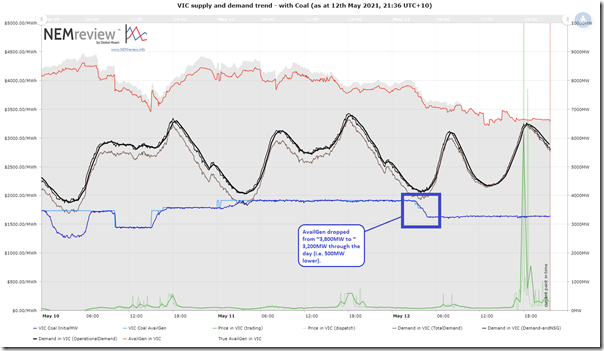
There were (other) units out for a start, but we also saw the another loss of ~500MW of available generation from coal units by 04:50 as a result of LOYB2 coming offline:
Here’s the NEMreview v7 query for the trend above, for those with a licence.
Note that LYA3 and YWPS2 were also offline for the day … but those outages pre-date the past 24 hours, and I’m particularly looking at what’s changed to deliver the price spike.
(C2) Wind output also reduced
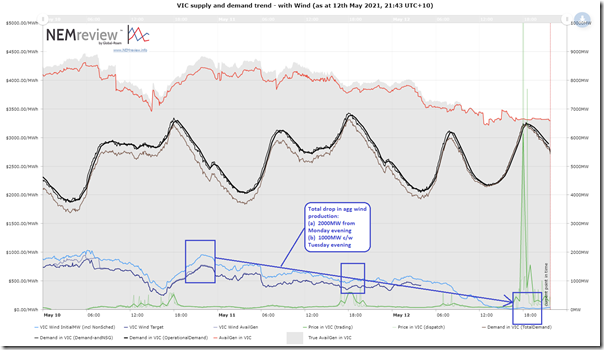
Compared with the prior evening, there was a 500MW drop in supply from coal – whereas the amount dropped from supply from wind was twice that amount from yesterday evening:
Here is that query from NEMreview as well.
(C3) Other factors
Adding together the 500MW loss from coal and 1,000MW loss from wind and we get something slightly more than the 1,300MW aggregate reduction noted above over 24 hours.
No doubt there were other factors, but I have run out of time this evening…
(D) The story for SA, NSW and QLD…
… will have to wait until I have more time…


Thanks for the quick writeup Paul
This was a whole-of-mainland high price event, with interconnectors unconstrained between the four regions.
The $14,950/MWh price in DI 18:00 was being set by EA’s Jeeralang units in Victoria with plenty of spare capacity in other regions but offered at prices that were in effect higher than this level when translated to Victoria after accounting for inter-regional marginal loss factors.
Overall I think your comment that there was a reasonable amount of NEM-wide reserve (5,400 Available capacity over Total Demand) is fairly pertinent – this capacity was simply being offered at five digit prices, showing that bidding dynamics, in addition to physical supply demand factors, was a major driver for the event.
Allan
Allan makes a good point about availability. It may be misleading if there’s spare capacity interstate along with some extra slack in interconnectors.
Oh sorry ignore that – you did mention it. But I do think a mention of interconnectors is relevant.
Trying to understand this a little more deeply. So there was capacity at interconnectors, and there was plenty (well enough) supply, but perhaps this supply was from a small number of participants who worked out they could set prices at high levels without being undercut? (I’m being careful here….)?