It’s been a number of years through which AEMO forecasts have pointed out the fast-approaching situation where “grid demand”* might approach 0MW during the middle of particular sunny days in South Australia, so it should not be a surprise to see demand going “down, down, down” (to the tune of that irritating jingle).
* Grid Energy is a general term we use to make it clear we are not thinking about supplies from embedded generation (especially rooftop solar). For the gory details of all the different measures of demand, see this earlier “Explainer about Electricity Demand” on WattClarity.
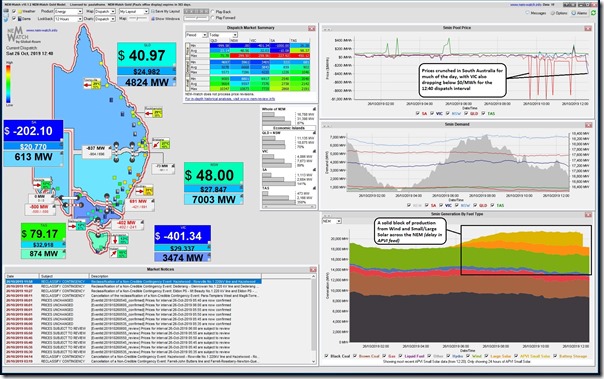
I’ve been out of the office for the prior week so have been catching up on a couple things today, but (as always) with an eye on what’s happening today – captured in this snapshot from our NEMwatch v10 entry-level dashboard from a earlier today, showing solid output from wind and solar across the NEM, at least in part contributing to low levels of demand in both Victoria and South Australia:
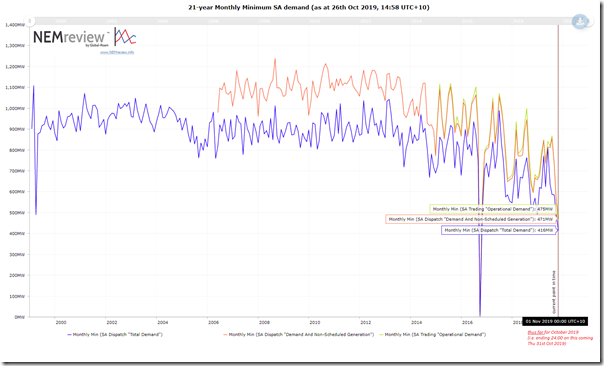
Now, I already posted this article here on 17th October noting that SA Scheduled Demand had dropped to a low-point of 490MW on 1st Sept 2019 (equal with the mysterious event back on 17th March 1999), and I thought it would be worth updating this NEMreview v7 trend, to show that the “lowest ever point” is now down at 416MW from “TOTAL DEMAND” (i.e. Scheduled Demand on a dispatch target basis) – being from 14:15 on 20th October, so a few days after my prior article:
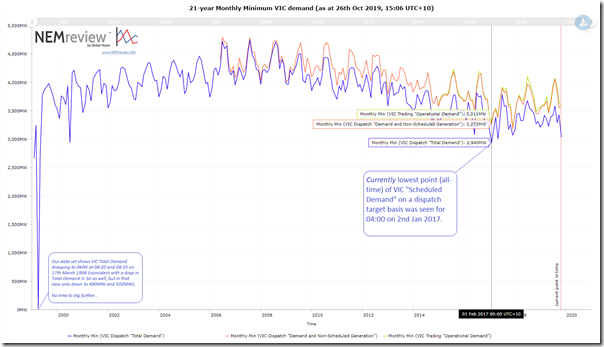
Out of interest, here’s Victoria also from NEMreview v7:
As noted, we’re still away from the lowest (non-zero*) level experienced in the Christmas-NewYear period of 2016-17 in the Victorian region.
If any long-term NEM junkies can help us understand what happened in March 1999, that would be appreciated!
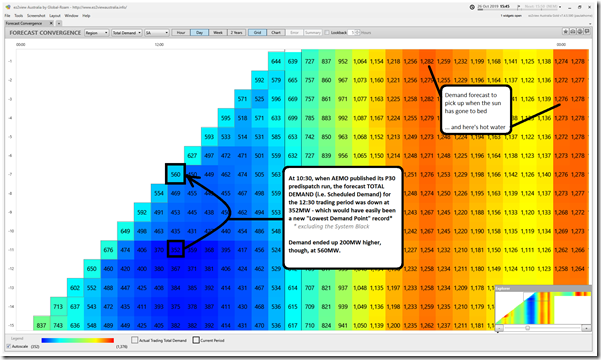
However the most interesting thing to occur today was how low the AEMO was forecasting the TOTAL DEMAND to fall for the 12:30 trading period from the 10:30 predispatch run – shown here through the use of the “Forecast Convergence” Widget in ez2view:
A 208MW difference may not sound like much to some, but it’s also 60% higher than the AEMO had been forecasting only 2 hours earlier! I’ve included this as an illustration of the challenges AEMO will increasingly face into the future.
No time for any more today. Would like to delve more into why the actual was so much higher, maybe a reader can help?


Leave a comment