Officially it’s the first day of autumn, but I don’t think the overheated residents of Victoria or South Australia would be thinking it brought with it a cool change.
This was forecast earlier in the week, as noted here on Wednesday. Of course forecasts don’t always match reality – particularly price forecasts:
(a) which incorporate the effect of human behaviour embodied in trader’s decisions in terms of how to price their production; along with
(b) a high level of complexity about how prices are actually determined.
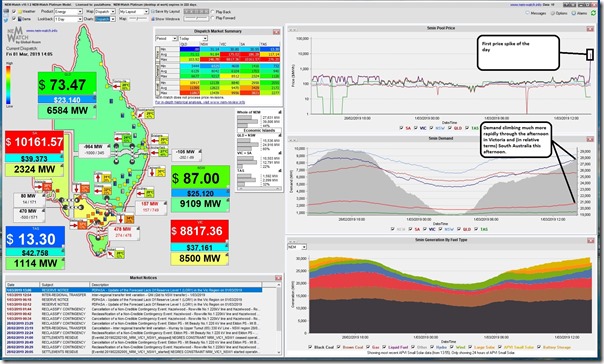
As it turned out, there were plenty of price spikes through the afternoon (an opportunity for reducing average cost of energy for Amber’s residential demand response customers, plus ours at the C&I level + others with different arrangements in place) – which is ongoing as I write this quick article .
(A) Prices through the 14:30 trading period
The price first spiked at 14:05 today, as shown in this snapshot from NEMwatch v10 entry-level dashboard :
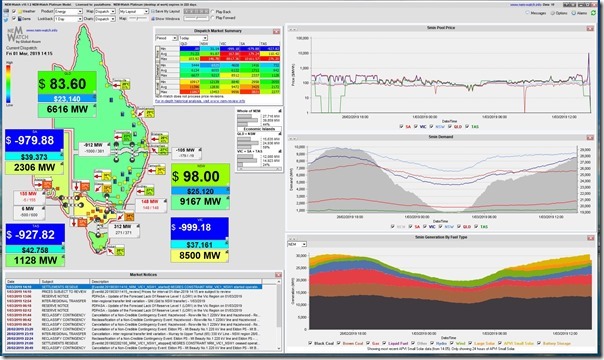
That price subsided into a period of negative price activity for the rest of the 14:30 trading period, as shown with the blue prices in the 14:15 dispatch interval.
There was a bit of a lull, then, until 15:25 when prices spiked again and remained more consistently high.
(B) Quick observations of operational patterns
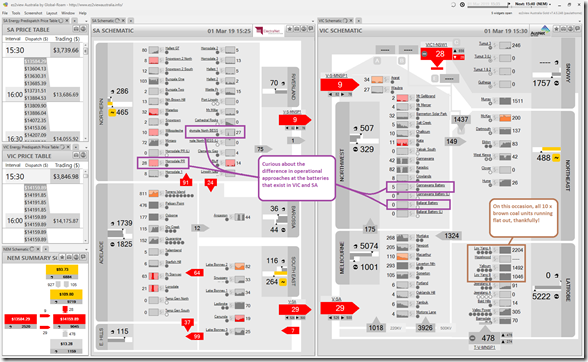
Don’t have time to post much more today, but just wanted to flag this snapshot from ez2view (higher-end dashboard) which shows two interesting points in the 15:40 dispatch interval:
The output data shown is “InitialMW” snapshots from 15:35 (for the 15:40 dispatch interval) and reveal a few things:
1) Unlike the case on 25th January, where it was one of the significant contributing factors in the Load Shedding, we see all 10 x brown coal units in Victoria producing well;
2) Most gas/liquid peakers are running, but some are not (e.g. Jeeralang A);
3) We see wind production quite low across both VIC and SA (on Wednesday I noted how the forecast seemed to be dropping away);
4) In contrast the solar farms producing up towards their maximum capacity:
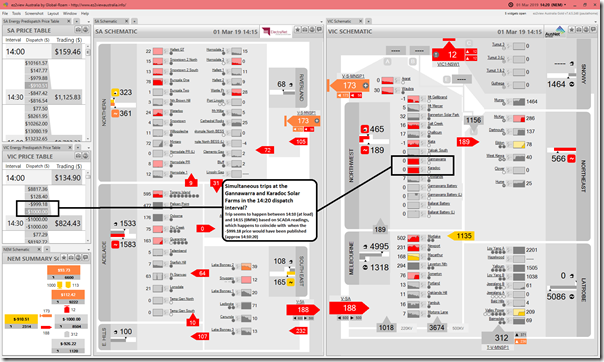
As a separate note which I might dig into later, I notice the simultaneous trip at both both Gannawarra SF and Karadoc SF in the 14:20 dispatch interval (i.e. InitialMW snapshot taken at 14:15, which also happens to be the first dispatch interval where the dispatch price dropped below zero).
I wonder if this was related to some strange bank of cloud cover, or a network issue, or this type of challenge, or something else I’ve not thought of?
5) I’ve also highlighted the 4 operational batteries (i.e. the Registered ones) in VIC and SA and have made a mental note to drill in further at a later date (perhaps when finished the work on the Generator Report Card 2018) as it surprised me that none of them seemed* to respond to the initial half hour of high prices in the 14:30 trading period – though the trading price did land down around only $1,000/MWh with the negative dispatch prices.
* Might have overlooked that in the time constraints today.
————–
One more interesting event to dig into further, when more time allows …


Yet another crazy price day. Its just nutty. The whole pice system is CRAZY.