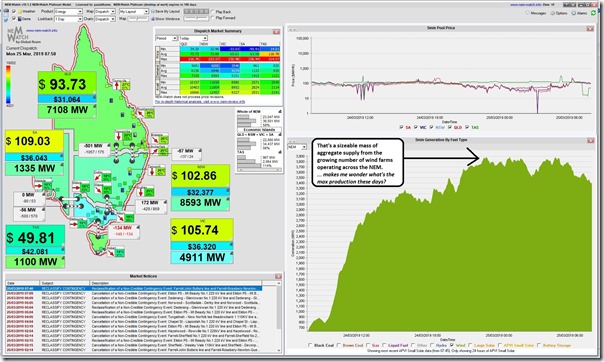
In the office early this morning to continue the analysis and insight generation for our Generator Report Card, I glanced across to the NEMwatch v10 dashboard running in our office and noted the large wad of green colour on the trended “generation by fuel type” widget within the application. Here it is again for reference:
Two questions that immediately popped into my head:
Q1) We see the current aggregate output peaked up around 3,900MW around 04:45 this morning (NEM time), and I wonder what the all-time maximum is these days?
Q2) I note that the mainland prices are all up around $100/MWh despite the consistent wind output at this point in the day, and can’t help but wonder about the contributing factors (remembering that it’s the majority of the time that “who’s setting the price” reveals a Complex answer).
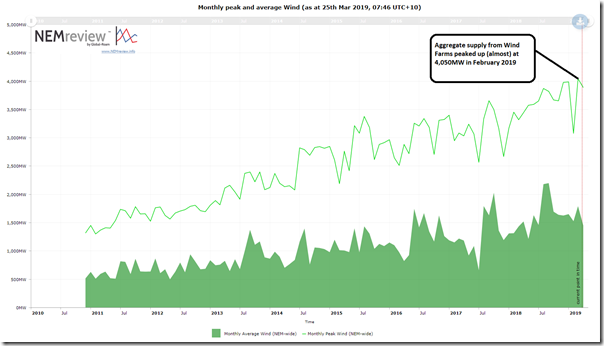
To avoid distracting myself from the work that must be completed so we can have the Generator Report Card finished as soon as we can (current schedule is here) I will leave the rabbit hole of Q2 alone for now, and just use NEMreview v7 to produce this trend of monthly peak and average contribution from wind over time:
We see that the aggregate supply from wind generation peaked up close to 4,050MW on 12th February 2019. So this morning’s effort was about 150MW below that.
—————-
We’re taking a more systematic look at Wind Production (as with all of the Fuel Types) in our Generator Report Card, and I’d best get back to that now…


Looks like the teeth are getting bigger and sharper
Meanwhile on 20 March (just 5 days before this topic was posted) wind output was:
Below 800Mw for the period 00:00 until 15:20.
Below 400MW for the period 06:30 until 12:40.
Below 200MW for the period 9:00 until 10:15.
https://anero.id/energy/wind-energy/2019/march/20
Celebrating a peak output is an odd choice given the system is only as reliable as it’s lowest output.
The problem of growing wind is that the absolute power gap left when the wind drops off on a national scale, also grows. When this occurs at times of high demand and with coal/gas being driven from the market also by increasing wind/solar, what is there to fill such ever larger gap events? Such shortfalls at times of low wind/high demand seem to be in part behind a number of the soaring spot prices in the last six months. Even $50 billion of grid changes and costly storage could only do so much. Disappointingly, it seems more wind = higher electricity prices.