I was away at the time so did not post on the day (though I was able to post this review late the night before, of what happened on Thursday 24th January). Last week I posted these follow-on thoughts.
Here’s two quick notes that I will refer back to later…
(1) Cumulative Price Threshold was reached for Victoria and South Australia
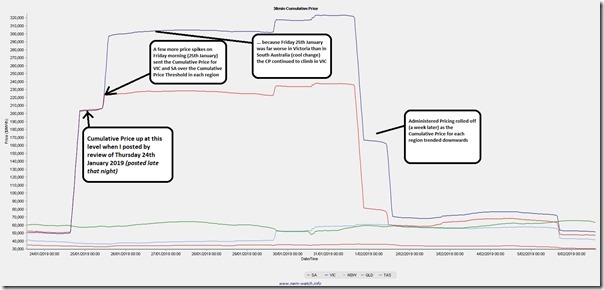
In my post late on Thursday, I noted how it was likely that the Cumulative Price Threshold would be reached for both Victoria and South Australia the following day.
As expected, this did turn out as expected – as a result of which spot prices were capped in South Australia and Victoria to a maximum of $300/MWh until Friday last week (1st February), as the Cumulative Price progressively wound down.
Here’s a view of what happened taken from within one of the windows within NEMwatch v10:
Because these instances are rare (and I will refer to them later) I have included a note in this post about it.
(2) Using “Forecast Convergence” to delve into two factors that contributed to the load shedding
This week I’ve fielded a few calls about two related things – about what happened on 25th January, and also about how we might use some of the functionality within our ez2view software to explore what happened (and particularly the “Forecast Convergence” widget).
Readers should be very clear that this is not intended to be anywhere near a comprehensive list, but merely to flag two of the contributing factors that were highlighted in this 7:30 Report Special “Off The Grid” which aired on 30th January 2019.
2a) Aggregate production from wind generation in Victoria dropped unexpectedly
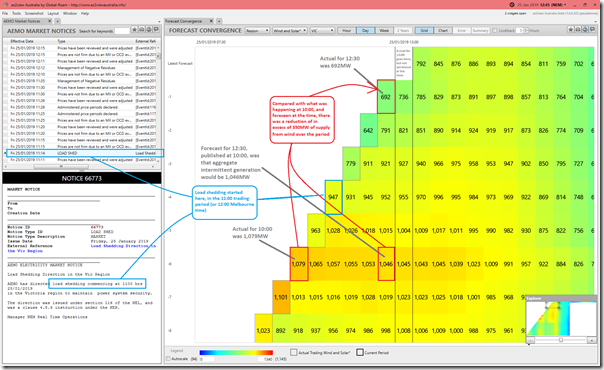
Here’s a view of two widgets together in a window in ez2view, Time-Traveled back to the 12:45 dispatch interval on Friday 25th January, which was under 2 hours after load shedding had started.
This highlights one of the other challenges faced by AEMO on the day. In the 7:30 Report story (at about 2:44 minutes in) Audrey Zibelman notes that the wind dropped markedly through the day in Victoria, and that what was perhaps more challenging was that this drop was not seen in their earlier forecasts.
With “Forecast Convergence” widget in ez2view, we can look at what the successive forecasts published by AEMO showed. In this case, we are looking at successive half-hourly forecast for supply from aggregate intermittent generation plant in the region (mostly Wind, but also an increasing number of Large-Scale Solar plant).
Click on the image for a full-screen view:
For those who have not seen this widget before, I’ve annotated in some detail to (hopefully) make it clearer. Through the period were Load Shedding was operating, we see that both:
1) The aggregate production from intermittent generation dropped by something like 350MW over the period; and
2) That this was not expected in the immediately preceding forecasts.
It would be the combination of both factors that would have been particularly challenging.
2b) Second unit offline at Yallourn on Friday 25th January
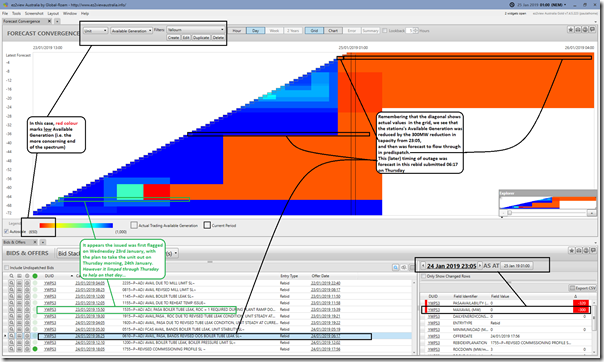
I missed it on my note on Thursday evening, but picked it up here last week, but there was a second unit at Yallourn removed from the market late on Thursday evening due to a tube leak.
Note that I have put this one second in the list not because it has less significance than the first, but because I hope (having annotated the structure of “Forecast Convergence” above) that readers can follow a “zoomed out” view where you are unable to read the numbers, except via mouse-over. Very sad that I am very cognizant of conspiracy theories at both ends of the Emotion-o-meter!
In this view of “Forecast Convergence” I am showing successive views of the aggregate Available Generation capacity at the Yallourn station (not so much forecast but stated plans at the time by the operator of the station) – where, in this case, red colours indicate lower levels (i.e. greater risk to security of supply). I have also Time-Traveled back to the 01:00 dispatch interval on the morning of Friday 25th January to highlight what evolved through the day.
Again, click on the image for a full-screen view:
In summary, my first reading of this data suggests that the operator (EnergyAustralia) knew they had a problem with unit 3 (a tube leak), and that they were trying to “limp it through” as long as possible in order to support AEMO with the very tight supply/demand balance through Thursday. However it appears to have reached the point on Thursday morning where they knew they needed to take the plant out from 23:05 on Thursday night into Friday morning.
The size of the reduction in available supply from Yallourn Station was 300MW.
Coincidentally, in this case, the effect of the two factors was similar in both cases (in aggregate level) – though obviously the specifics were different:
- The whole of the 300MW reduction from Yallourn unit 3 was off for the whole day on Friday – but was telegraphed in advance from Thursday morning.
- Whereas the loss of supply from wind was shorter-term in nature, but also not forecast in advance.
Both were contributing factors (two amongst many!), and each had their own challenges….
————–
As always, any errors in putting this quick post together are entirely my fault.
… now back to the number crunching and analysis for the Generator Report Card 2018.


The loss of coal generator units is going to happen more and more as we run them at 100% to make up for the closure of other coal plants (hazelwood) And the lack of reliable supply from renewables.
Of course we will get people like Di Natale blaming coal but the reality is that when we had hazelwood in operation there was spare capacity so you could take a unit offline for repairs and maintenance and they only had to be run at 80-90% output so they wasn’t breaking down as often.
Look, Wind/Solar and Batterys, do not have any issues, they work, when the sun shines, or the wind blows, it depends on the amount of wind, and direction, also the amount of sunlight and temprature, as well as how clean the pannels are, the battery’s work when ever they are needed, not as good when its hot, and as they age, but they still go. Now all of this stuff has to go through inverters and they work better when its cool, not so good when its hot, and the inverters can maybe at times not work, but there will be so many, you will not miss a few here and there not working and they will not be down very long because they will just be fixed quickly. So all in all, RE, just keep working all the time, they never stop. Vs Coal plants that stop. Cannot anyone understand that.
John, no rational person despises wind farms and solar panels, but a power supply network has to be able to supply electricity to match demand. When demand increases, either the power generation increases to match, or a storage option is called on, or the power is not delivered (blackouts, load shedding, demand management).
There is a place for demand management (as long as it is voluntary and doesn’t cost more than generation) and there is a place for storage (as long as it doesn’t cost more than other forms of generation and does not reduce the overall capability of the power supply network e.g. harmonics, fault level, inertia, reactive power).
Wind and solar cannot increase output on demand.
Power electronics (inverters) cannot deliver fault current, and only the latest technology can support frequency.
A business cannot operate when its power source depends on favourable weather.
Trying to compare a 40yr old coal plant suffering tube leaks with vagaries of the wind is not a suitable comparison.