The islanding of Queensland and South Australia from the rest of the NEM on Saturday 25 August (noted on WattClarity on Saturday, as it was occurring) was certainly one of the more significant events in the NEM’s history.
Islanding events of individual regions in the past 20 years of the NEM have thankfully been rare, let alone islanding of multiple regions. As noted to one of the journalists who called that weekend, I can’t remember that happening before (still not have had time to check to be definitive).
Whilst the event is still being investigated by AEMO (we understand an initial report is imminent), we fielded a number of requests for further information. So as time has allowed (and with a bit – a lot* – of external assistance) we have put this together this post to explore some of the aspects of what happened that are of interest to us.
* Full Disclosure – the good insights here are not from me, but the mistakes probably are!
We are increasingly working with a range of external resources to help extend our understanding of the NEM, and capacity to analyse events like this. In this case, much of this work was done by a couple of Analysts who would rather not share the spotlight. In this case, any good insights in this post come from them – whilst any mistakes made are almost certainly mine.
In the case of this analysis and post, we have done this primarily because we’re passionately curious to learn more – and as it helps to drive our software further. We’ve posted it here as it might also help others:
1) those new participants in the market,
2) a growing number of interested observers and commentators, and
3) perhaps even the old hands.
If you also have the (capability and) interest to help us in this way, please do give us a call and let us know – tel +61 7 3368 4064.
A high-level summary of the event:
- The separation event occurred around 13:12 AEST, with both the NSW-QLD and Vic-SA interconnector tripping (**see possible explanation below of why Heywood tripped in sympathy);
- Load shedding occurred in three regions due to automatic under-frequency load shedding arrangements and included 724 MW in NSW, 280 MW in Vic and 80 MW in Tasmania.
- SA was resynchronised at 13:37 (constraints revoked in 14:45 dispatch interval), and Qld at 1420 (revoked in 14:45 interval);
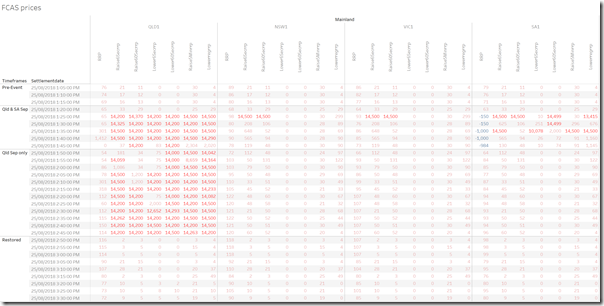
- High FCAS prices in both Qld and SA up to $14,500 / MWh as a result of these services having to be sourced locally (ie within the region); and
- No large generation (>200MW) was lost, although some smaller units tripped, with some large thermal generators in Qld rebidding to manage the output of their units which were affected with the frequency management of the power system.
We have based this particular post on the NEM 5-minute and 30-minute data, as opposed to the 4-second Causer Pays Data which we posted about here.
(A) Pre-conditions and Initiating Event
We understand from comments from Paul Italiano (CEO of Transgrid last Saturday in the AFR here), that lightning struck the two main transmission lines in northern NSW that make up the Queensland to NSW Interconnector (QNI) around 13:11:50 on Saturday, 25 August 2018. According to Paul’s comments, it struck the same ‘phase’ on each of the lines which is unusual, thereby creating an electrical fault on the lines which then needs to be ‘cleared’ by the power system elements. Although at the time of the event this was classified as non-credible contingency (it has subsequently been reclassified as a credible contingency now), it should still have been ‘ridden through’ by all generators.
Unfortunately, despite early reports of no generation loss, there were some generators that did trip, but this is discussed later in this post.
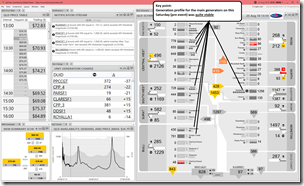
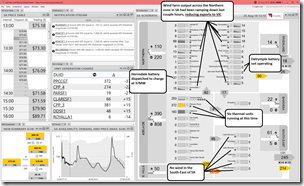
For the 13:15 interval (which signifies time-ending 13:15, which is released around 13:10) the power system conditions in Qld and SA were relatively stable, as shown in these schematics from ez2view:
| QLD Region | SA Region |
 |
 |
Click on the images above to see the details.
We’ve only shown QLD and SA here, as these are the regions we have focused analysis on (it would be worthwhile as a further follow up to look into NSW, VIC and TAS, but this will only be if more time permits later…). Important aspects to note prior to the event:
- SA was sending ~260MW to VIC (with a limit of approx. 500MW), QLD was sending ~900MW at near full capacity, Basslink was export a maximum of 478MW to VIC from TAS.
- Wind in SA and VIC was quite low, as was demand (minimum for the day had been reached in SA at a low 725MW due to high levels of Solar PV across the NEM ~3000MW)
- Energy prices in all regions was between $69-$80 on the mainland ($9 in Tas under full export on Basslink), with FCAS prices below $20/MWh in all mainland regions for raise and lower services)
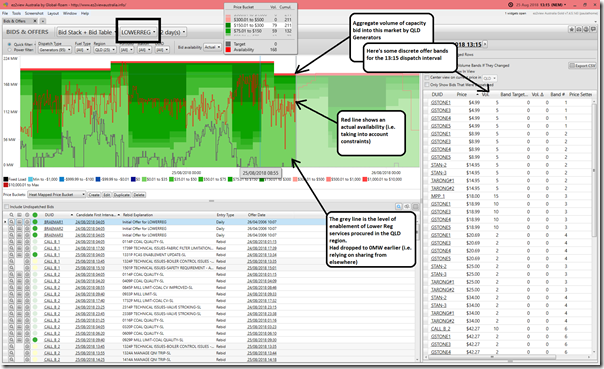
- Interestingly, there were no Qld generators enabled for lower services (5min, 60sec and 6sec contingency services or lower regulation)
- See the example below from ez2view showing that enablement target of Lower Reg services locally in Queensland had dropped to 0MW earlier that day:
- This may come up as a further issue along the lines of Kate Summers post here on Tuesday 28th August (coincidentally following the islanding).
- Similarly there were no generators enabled for raise services in Tasmania.
The lack of lower FCAS services procured locally in QLD meant that, in the case of QNI trip (as was the case on the day) there would be no-one locally in Queensland contracted to reduce frequency.
Even apart from this, my understanding (thanks to those who have explained) is that the dispatch signals would have been sent initially with reference to the frequency in Sydney in any case, until the frequency reference point for “NEM North” was reset to Queensland. Hence, until that change was made, my understanding is that there would not have been any signals sent to reduce frequency in the QLD region (*see correction), as the reference frequency was seen as dropping (not increasing, as it would have done in reality).
* PS, and correction
One knowledgeable reader has pointed out an error in the last paragraph above, because:
(1) Whilst Regulation Lower service would have been dispatched centrally, hence not dispatched in a QLD with (actual) rising frequency if the opposite was being observed because of the observation point; but
(2) The Contingency Lower services would have triggered, as they do so based on local frequency.
Thanks for that correction!
(B) At the event
The event occurred around 13:11:52, as highlighted in the post last Monday. With frequency heading in two different directions (i.e. up sharply in QLD and SA, and down sharply in NSW+VIC) it might be useful for some readers to review this refresher in what the implications were:
Although the 4sec data is very good for many things (and is used for Causer Pays Factor Calculations), we have found there are errors associated with it:
- There are obvious time delays and mis-matches between timestamps;
- The Heywood interconnector (Vic-SA) flow was showing MW transfer for a further 40seconds compared to what we understand now (the interconnector tripped within a few seconds of QNI tripping (**see possible explanation));
- The 4sec data for the Hornsdale battery shows no generation, yet the high-speed Tesla data (initially posted on RenewEconomy and then copied in here) indicates an expected response; and
- The NEM north and NEM south frequencies are clearly not inclusive of Qld and SA (and only show NSW and Vic?)
**PS, and possible explanation
Another knowledgeable reader has explained what the cause of the Heywood trip might have been – which is essentially the automated trip (due to an automated protection system) in response to the rapid increase in flow eastwards on Heywood that would have resulted after flow south on QNI was cut. Paraphrasing the explanation (so apologies if I mess it up):
(1) The protection system had been in place for more than a decade to cater for a differently envisaged scenario (e.g. the link from Portland smelter to Melbourne is cut, hence massively increasing the load on the South Australian system and increasing flow east from SA); but
(2) In essence (it seems) what unfolded on 25th August was a scenario not really envisaged when that protection scheme was put in place.
Thanks for that addition!
Under such a scenario, the frequency in SA would have firstly dived (in conjunction with NSW+VIC) but then, after the trip of Heywood, jumped back up above 50Hz. This would have caused fast-responding plant to swing similarly. Hence the swing in output shown in the HPR charts from Tesla/Neoen.
(C) Immediately following interval (13:20)
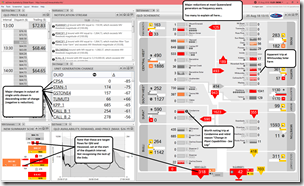
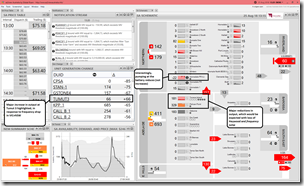
The following screens for QLD and SA show the next Dispatch Interval (13:20), with all units highlighted in red having changed generation by more than 15% (with a couple trips). Note in ez2view we use colour (amongst other techniques) to draw your attention to what’s important – a red colour highlights a change by more than 15% up, or down:
| QLD Region | SA Region |
 |
 |
It is possible to see the event un-folding in the data;
- All energy and FCAS prices in 13:20 remain roughly the same as 13:15
- In the images above, we see that NEMDE is still showing non-zero dispatch target flow for the 13:15 dispatch interval over QNI and Heywood:
- This is despite the fact that the links have tripped just prior to the start of the dispatch interval
- It’s been suggested that this might be a function of the DATASNAP process AEMO do to capture all the inputs to their NEMDE process
- There are numerous changes seen in generation output in Queensland, with reference to the SCADA data sampling time (i.e. around 13:15, leading into the dispatch interval):
- We see many large thermal units significantly reducing their output – we assume that this is in response to high frequency (though we note, as above, that none of them were contracted to provide FCAS Lower Services)
- Several generators in Qld seem to have tripped – (Condamine (Gas) and Whitsunday (Solar)) – and other semi-scheduled plant experienced large changes (Collinsville PV (Solar), Hamilton and Kidston (Solar)), but this might have been natural variation due to local cloud cover.
- In the two schematics (via live intra-regional flow data provided through us from Powerlink and ElectraNet) we see major changes in flow in the network, as would be expected:
- In Queensland all the flows are lit up, except (curiously) Central West to Gladstone
- Similarly in South Australia.
(D) Next dispatch interval (13:25)
Given the time into the 13:15 dispatch interval that the event occurred, it took the following dispatch interval, 13:25, before AEMO was able to invoke network constraints that represented the prevailing physical conditions in the NEMDE model.
Under such separation conditions, AEMO invoke network constraints that tell NEMDE that the regions are separated. Between the 13:15 interval and 13:25, nearly 200 additional constraints were invoked to reflect these conditions. Critically, many of the invoked constraints were not only binding (a marginal value <> 0), but were violating, meaning NEMDE could not find a suitable solution.
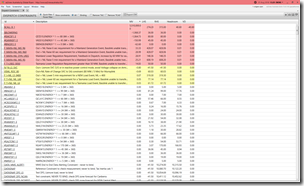
Once the new constraints were invoked, NEMDE calculated new pricing outcomes and things began to get interesting (the below screenshots show the binding (red) constraints before and after the event – note the Violation Degree (VD) column is non-zero!) in the 2 pages of critical constraints for the 13:25 interval.
| Constraints invoked at 13:20 | Constraints invoked at 13:25 |
 |
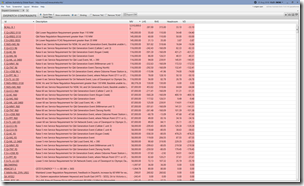 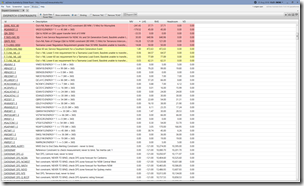 |
In this particular widget within ez2view, we use colour to flag constraints that are bound (yellow) or significantly bound (red). We can see without even clicking to expand the escalation in the sheer number of constraints bound, hence indicating the seriousness of the situation…
For SA, the physical separation lasted ~25 minutes, whereas for Qld, it was an hour and 10 minutes. However, it was not until 14:45 in Qld that the last of the separation constraints were removed and the market resumed ‘normal’ operation.
Therefore, we have broken the analysis into post event (while SA and Qld were separated), post SA restoration (Qld still isolated), and all restored.
(E) Both QLD and SA separated
With the newly invoked network constraints, energy and FCAS prices started to change in both SA and QLD, as shown below (we have excluded Tasmania since its prices were largely the same).
There was a short period of price volatility in the energy market in SA (very low prices given it had excess generation as it was an exporting region at the time), with some high FCAS prices in SA, but mostly in QLD.
(F) QLD Generators
Qld generators initial rebids were mostly plant related (CPSA to bid off, Gladstone for boiler control issues), but also to match the capacity of their Units with the output of the Units which would have been pushed around with high frequency. Some rebid to lower price bands, presumably to try and counter constraints were also occurring (ie Kogan Creek).
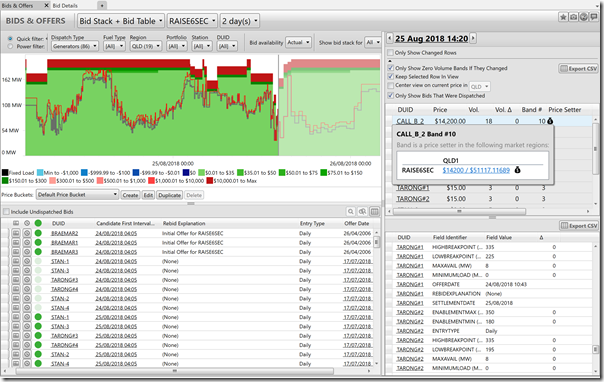
A snapshot of the bidding at the time of the event shows some of the rebid reasons:
Later, some generators also adjusted the FCAS offers in response to what was happening in the FCAS markets although in general there was an inadequate supply of FCAS for the Qld in all FCAS services (we can tell this from the difference between the RRP and RRP prices – we will leave for another time).
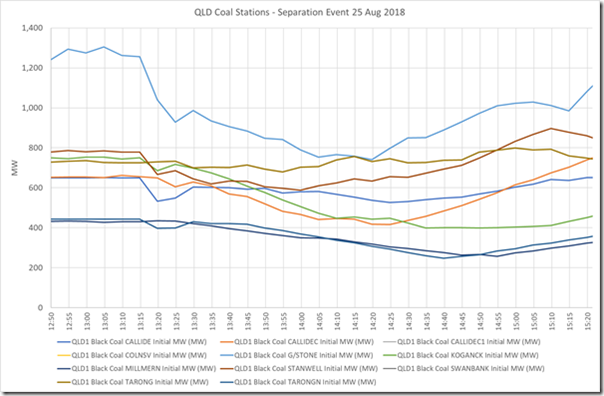
Coal Generators
Coal generators showing a decline in load at most stations, initially when the event occurred, and over the course of the separation.
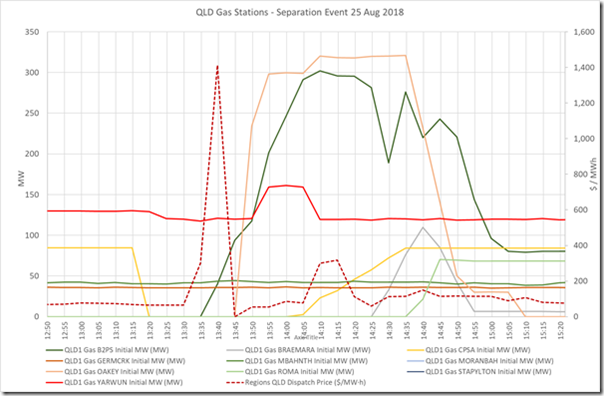
Gas Generators
Many started while Queensland was in an island state. These included:
- Oakey
- Braemar 1
- Braemar 2
- Roma
- CPSA came off immediately after the start of the event, but then returned to service approx. 30 minutes later.
There were various reasons for starting, depending on the participant. Some were unrelated to the event, such as in the case of Arrow (Braemar 2) quoting “fuel management : Increase in expected gas deliveries”; whereas others such as Origin Energy (Roma 7) quoting “Constraint Management – QN_ZERO – SL”.
Hydro Stations
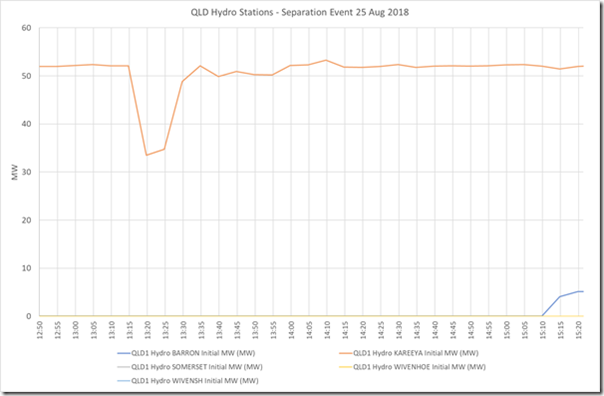
Kareeya had a significant drop in load at the start of the event but then resumed its normal load 20 minutes later. The drop in load presumably in response to high system frequency.
Large Solar.
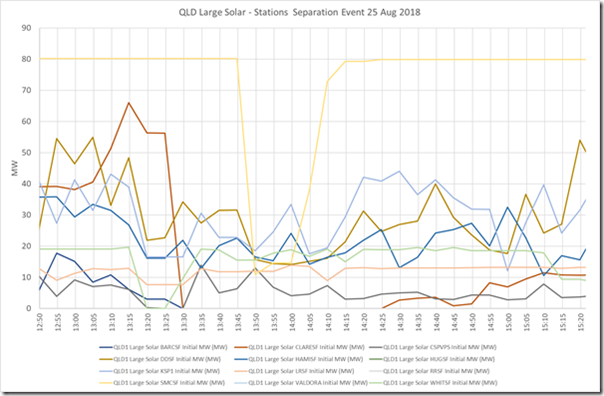
There was a 100 MW drop in Large Solar at 13:20. Some came off line, such as:
- Barcaldine
- Clare
- CSPVPS
- Whitsunday (interestingly, we note that this unit seemed to be generating with no volume in any price band?)
Others reduced in load initially at the start of the event, and slowly came back up to where they were before.
Rooftop Solar PV
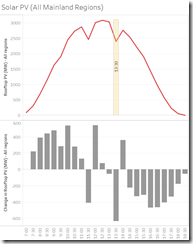
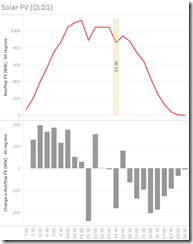
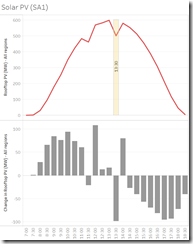
There was also a 150-200MW drop in small Solar in Qld around the same time, although it is difficult with the prevailing data to determine the extent to which this was due to the event, or it it was irradiance related (although you will note the drop around 11:30, which happens most days is a far more gradual decline which suggests irradiance).
The drop in SA and through the mainland is far more pronounced than in Queensland.
| All Mainland Regions | Queensland Region only | SA Region only |
 |
 |
 |
In this case, we have used the AEMO’s estimates for Rooftop solar (but note the caveat previously posted about the opacity of small-scale PV).
Liquid Fuel
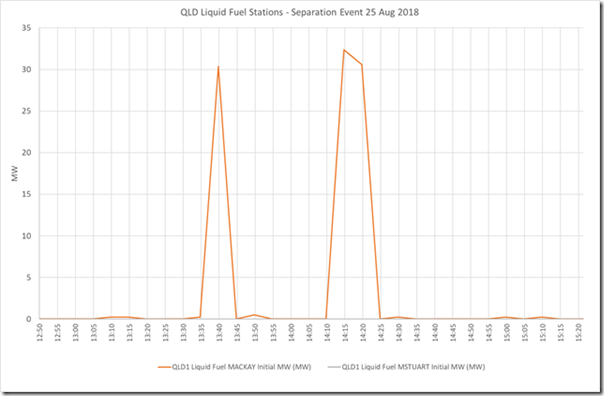
Mackay GT started twice during the event, but shutdown a short while later each time.
Rebids
In Queensland there was some changes in volume across bid bands on some generators as the co-optimisation occurred between energy and FCAS (delivering relatively low energy price, but high FCAS prices). In some instances, rebids were also accompanied by changes in availability of the services, with many bidding more volume to lower bands to try and counter the constraints that were acting on the generators.
Looking at Dispatch outcome and rebid reasons on the day from CS Energy, it was evident that some power stations were certainly being moved around by the frequency changes. Energy and FCAS Rebids submitted for Callide and Gladstone Units shortly after the event included words such as “Technical issues – Boiler control issues – QNI trip” as shown above.
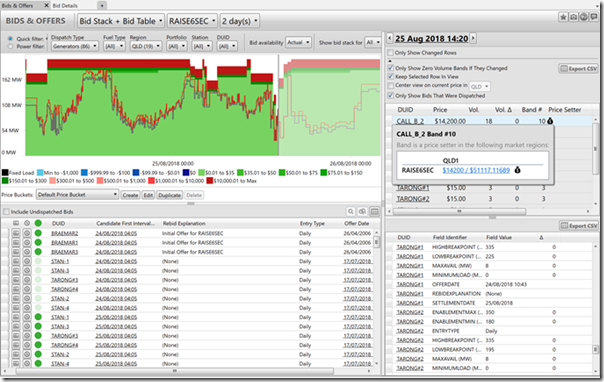
The effect of the rebids included reductions in availability of the Units. For Gladstone the reductions were quite significant, down 1465 MW to 1031 MW for the Station, and for Callide B 650 MW to 602 MW. The FCAS capability of Gladstone was also significantly reduced during this time such that it was unable to provide the level of services it was before the event. Callide, despite some reduced energy generation, was able to operate near full availability to provide FCAS services and set the $14,200/MWh for many intervals, as shown below in the price setter display from ez2view:
(G) SA Generation
Given the separation event was far shorter for the SA region than QLD, we haven’t focussed too much on the outcomes in this region. There did not appear to be any major rebidding from AGL’s Torrens Island, although the AGL wind portfolio was bid to lower prices levels due to ‘UNFCAST NETWORK CONSTRAINT~HEYWOOD TRIP’.
The Hornsdale Power Reserve continued to operate through the period, although its rebid reasons did highlight that its ‘energy in the tank’ may have been low, as the rebid reason ‘.. SOC [state of charge] LIMIT’ was used regularly through the afternoon.
(H) In conclusion …
There has been a lot of discussion on the event, which is spurring us to (with some external assistance – thanks very much) delve further into the data so we can understand more, and drive our software further.
- We hope that the analysis shared here will also be of use to our readers.
- We (and/or some guest authors) might have more to share in the coming weeks
As always, any questions, please give us a call:
tel +61 7 3368 4064


Thanks for the analysis!
AEMO’s 4s data has been referenced a few times, which contains two measurements of frequency – one each for NEM NORTH and NEM SOUTH. Do you know where these are measured from?
Just after the event I happened to look at the display of my inverter (a new Fronius), and was surprised to see it rebooting. Then after the reboot there was a “clunk” of the relay, and it gradually began to show the amount of power from DC to the home and grid. It was a sunny day here in southern Victoria, so there would have been a reasonable contribution of rooftop PV to demand. The inverter specifications show it tolerates frequencies down to 49 Hz, and there is no setting for the rate of change of frequency.The 4-second data show it didn’t quite do down to 49.0. Their data are presumably the average frequency of the 4-second interval. However what AEMO should be logging is the max and min frequency in each 4-second period, because it is the max or min frequency that will turn off the small-scale inverters. As inverters become an increasingly larger proportion of daytime power supply, should we be requiring a wider range of fault ride-through settings?
Can we get some analysis on what impacts the Hornsdale Power Reserve had on the spot price in SA during hte islanding event.
It was meant to be the saviour during events like this but it seems they were low on charge even though Hornsdale Wind Farm had been operating above 75% capacity factor for most of the 2 days before the event.
AEMO final report is out 10 Jan 2019. Eight recommendations, the first and most obvious / important being to reinstate primary frequency control.
https://www.aemo.com.au/-/media/Files/Electricity/NEM/Market_Notices_and_Events/Power_System_Incident_Reports/2018/Qld—SA-Separation-25-August-2018-Incident-Report.pdf