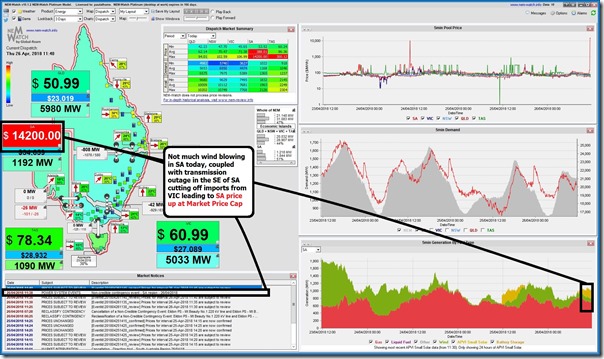
A brief post today, to follow the earlier two tweets this afternoon, and because we might come back and revisit this day at a later point in time. In the first of the tweets, I posted this snapshot from our NEM-Watch v10 dashboard to illustrate the 11:40 dispatch interval where the spot price had jumped up to the Market Price Cap (MPC) of $14,200/MWh:
This was the third dispatch interval in a row that had seen price at that level – we’d seen the price spike first for the 11:30 dispatch interval, following from the trip of a major transmission line and substation in the south-eastern part of South Australia, which removed the capacity of importing lower-priced electricity from Victoria into South Australia.
Given it was a period of low (and dropping) wind today in South Australia, South Australia had been importing from Victoria to keep prices low. The loss of the interconnector required peaking capacity in South Australia to ramp up leading to the price spiking.
Given the small number of generators in the state that own dispatchable capacity (thermal generators and batteries) this has led to a situation of high prices through the afternoon (overlaid with the see-saw outcomes resulting from the 5/30 issue, which is with us out till 1st July 2021).
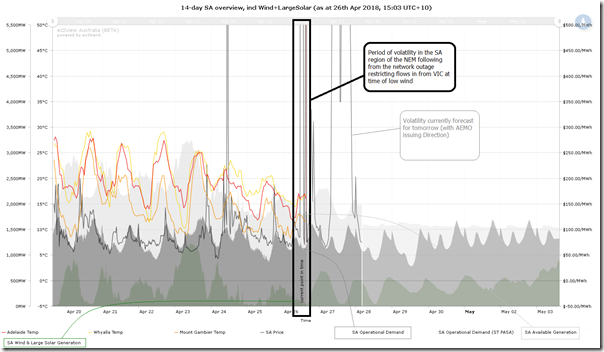
Here’s a Web-based Trend Chart from ez2view that shows the past week, and a forecast week into the future for the South Australian region, but remember that clients can access the live updating version of this here:
That’s all I have time for at this point…


Let the graph speak for me-
http://anero.id/energy/wind-energy/2018/april