Yikes!
One of the advantages of running the full NEM-Watch software continuously as an entry-level dashboard in our office is the progressive education that this delivers – particularly in relation to changing patterns (for a whole range of different variables) that are occurring in this multi-faceted energy transition.
One I have been puzzling about recently has been what has seemed to be a much lower production level from wind farms, NEM-wide, than what I had become accustomed to seeing (i.e. given my sense that winter had seen peak wind outputs in prior years).
1) I’ve puzzled about this, but have not had time to dig any more to this point.
2) Coincidentally, I also noticed this article by Stephen Letts at the ABC in catching up with goings on this week noting that Infigen had revised its revenue/production forecasts downwards due to what is implied has been lower wind levels than they had expected. Stephen quotes them as noting:
“The current quarter is expected to include two of the lowest production months for Infigen’s current Australian operating assets.”
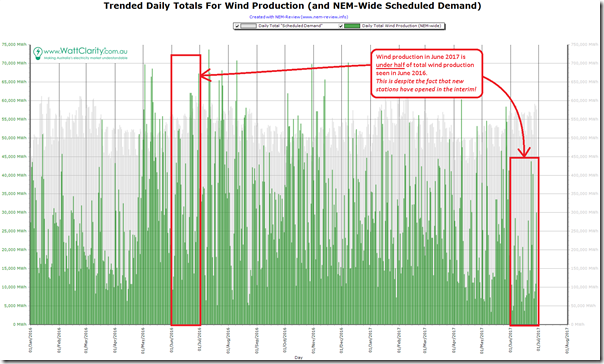
Hence today, I have been able to invest a couple hours to have a bit of preliminary look, using NEM-Review v6 and first produced the following trend of daily average production from all wind farms across the NEM:
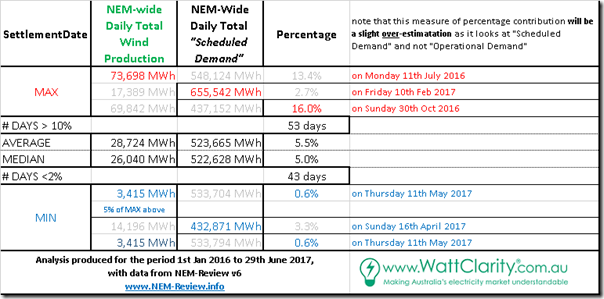
On the chart I have also included (on the Y2 axis) total Scheduled Demand NEM wide, scaled to allow readers to infer the approximate percentage of total production on the day. Some days we see production has been more than 10% of total Scheduled Demand, some days below 1%, and most mid-way between. Specific stats from these two series of daily aggregates are noted in this table:
There clearly are some highs and lows in the above – as would be expected from an intermittent supply:
THE HIGHS:
- Highest percentage contribution up at a large 16.0% on a weekend day (Sunday 30th October), when total demand was below average (437,152MWh on the day); but
- A higher total output from wind on Monday 11th July 2016 up at 73,698MWh for the day (part of the reason that I had come to see winter as windier months, I believe).
THE LOWS:
- Wind contributed only a meagre 0.6% on a remarkable day of Thursday 11th May 2017 when everything across the NEM was becalmed (incidentally a day for which load shedding was initially forecast on the Monday, and part of a run of low production days spanning May and June);
- As noted in the table above, the production of only 3,415MWh on that day represents only 5% of the peak daily output seen 11 months earlier on 11th July, and only 12% of the average over the period.
Keen data junkies will have noted the slight simplification I have made in this analysis, in that I have used Scheduled Demand instead of the (slightly larger) Operational Demand as the denominator. Please keep this in mind if quoting the percentages (i.e. the percentages above will be slightly higher than the “real” percentages would be).
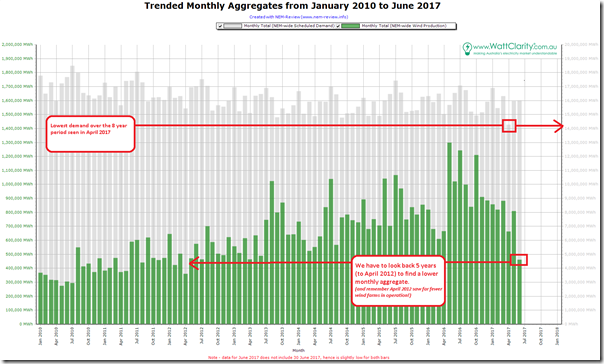
Chunking the data up to monthly totals through NEM-Review, and so extending the time span back to January 2010 we see the expected growth in wind output as an increasing number of wind farms are commissioned over the 8 year period. As can be seen, aggregate production is progressively climbing, as a percentage of aggregate “Scheduled Demand” to be fairly consistently around the 5% mark.
This growth makes the remarkable low point of June 2017 stand out like a sore thumb:
As highlighted on this chart, we have to go back to April 2012 (just over 5 years ago) to see a lower aggregate production from wind. That’s truly astonishing. Considering that there have been many new wind farms commissioned in the 5 year period (like Hornsdale in July 2016 and Ararat in August 2016), it does beg two questions:
1) More academically, on a like-for-like basis, has the aggregate wind output ever been lower?
2) More practically (and very importantly), where has the wind gone, and why?
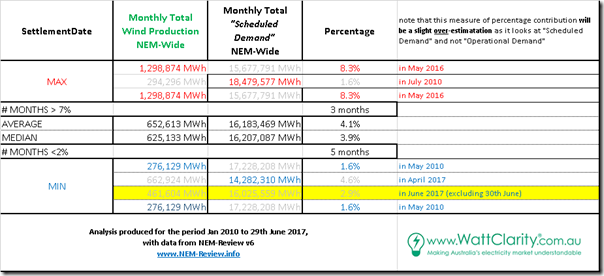
On a monthly basis, I have included the same table structure as above, for those who think numerically.
One standout for me has what’s happened over the past 6 or 7 weeks, including the low of 11th May.
1) Where has the wind gone?
This is not just an academic question, but one that should be the focus of considerable attention, given the high likelihood that the NEM of the future will be heavily dependent on wind as one of two main intermittent supplies.
Even assuming large amounts of battery storage in place to enable time-shifting of energy, seeing that total wind generation in June 2017 is under half of the level seen in May 2016 (highest month thus far), despite the new wind farms commissioned over 12 months, does raise concerns about ensuring we have enough (and what that might cost)!
Perhaps May/June will continue being the period of extremes – I note, as well, that the lowest production in the 8 year period was seen in May 2010.
I’ve posted this article here, and will follow up directly with some of our regular readers in the various weather forecasting/watching businesses that serve NEM participants and others to see if they are able to provide an explanation:
(a) Either a shorter one in comments below; or
(b) As their own follow-on post.
2) What are the implications
Now (hopefully) before some of our readers jump on their chosen hobby horse at either extreme of the Emotion-o-Meter, let me just reiterate my position that the glass can be half-full and half-empty at the same time:
2a) To the “sky will fall in” people on the far right
This actual occurrence of a massive drop in wind production over 13 months (May 2016 to June 2017), including a huge step down from May 2017 to June 2017 does not mean the energy transition can’t be achieved ….
2b) To the “she’ll be right mate, just go faster” people on the far left
… it does, however, indicate that we (as an industry) need to be far more sophisticated in our approach to planning, business development and operations than has been the case to date & that the mechanisms that have got us to where we are (the RET being one of them) are not going to be good enough to get us where we need to go.
PS Factors contributing to low wind farm output, NEM-wide, in June
[comments added on 3rd July]
Thanks for the various comments (below, over on Twitter and LinkedIn, elsewhere online, and also directly). It all helps me to understand better.
Summing up so far, there are at least three factors contributing (we’ll post more as a separate articles on WattClarity, as time permits):
Factor 1) Low wind speeds
First and foremost, there have been some of the lowest wind speeds recorded for many-a-year.
I’m still hunting up an explanation from those who know far more than me about this, in terms of:
(a) What has caused this; and
(b) How likely it is to happen again.
Factor 2) Possible Plant problems?
I have been told that Boco Rock Wind Farm (in NSW) has experienced some serious technical problems with rotor bearings.
A quick check with NEM-Review shows that they had low output from 8th to 23rd June, but I have not had time to check further…
Factor 3) Aggregate output constrained down in SA
Coincidentally, over on RenewEconomy here, Giles posted this article on Monday 3rd July to highlight recent constraints on wind farm output.
When time permits, I will delve into more detail over a longer time period (i.e. the months above) to see what effect this will have had on average outputs


I doubt the energy transition can be achieved with a significant presence of wind power. Seems to have been amply demonstrated multiple times , with Germany living through similar doldrums earlier this year, but happily being able to lean heavily on neighbours.
You point 2b is well made. These weather patterns are not new, so plunging into high % wind with 100% backup of whatever type is at the very least irresponsible.
Since solar lulls are never going to go away, and wind power lulls must now be counted as credible contingencies the word “transition” is surely inappropriate. If people insist that the country has to be carpeted in solar panels and wind farms then their output will only ever be the alternative power system, there will have to be another power system that can provide almost full demand when required. Thus, the only “transition” is one from sanity to insanity.
Thanks Paul for a very timely and appropriate review.
As a resident in Victoria with clients in SA and Tasmania, we have all noted that the weather patterns in May and June this year particularly have been dry and regularly still (or low wind).
The BOM has noted this in a number of weather reports and points to a a changed weather pattern where there has been effectively a ridge of high pressure over the southern states where most of the wind farms are located. This high pressure ridge has meant that there has been lots of still and low wind days.
But what has caused this to occur is beyond this simple engineer but I suggest that a question to the BOM might lead to a much more detailed answer
Regards David
BoM reported a couple of weeks ago that the low pressure systems which normally traverse southern Australia at this time of year are (for some reason) further south, closer to the Antarctic, than usual. Hence less wind than usual.
Look up the Southern Annular Mode (SAM) on the BoM website. It has been in a positive phase, which has meant fronts well to the south of the continent, and weak winds within the latitude of most of the wind farms. The SAM shows persistence but can’t yet be predicted. The wind industry isn’t the only one suffering – grain farmers on Eyre Peninsular have had less than 10% of their normal June rainfall. A more strongly positive SAM may be an outcome of climate change. For the power industry, offsetting investments include solar, which would tend to be higher during high pressure periods, and wind farm sites such as Hornsdale that have good exposure to easterlies. Power demand has I expect also been down because of mild weather.
In agricultural research it has been common practice to test new management practices on simulations based on 30 to 100 years of weather data, with the anticipated effects of climate change. Perhaps this should become standard in the power industry. Studies such as that of Andrew Blakers only seem to go back to the start of the NEM, rather than imposing NEM power demand on a longer period of weather data combined with known climate change effects.
Hey Malcolm,
Good point using A longer climate record is always a good idea for planning, however I suspect agricultural research is much more concerned with rainfall which in a farming nation like Australia was obviously a huge focus of our observational stratergy. Perhaps wind wasn’t recorded with such diligence?
I believe SAM is also related to ozone good work out of Monash university on this.
Cheers,
Peter Degorski
Dear Paul
I would certainly be interested in knowing what impact of the recent change in weather patterns has had on the off shore wind data for the same period.
It would also be great to have the MWh total per month of wind which has been rejected due to oversupply in the winter months.
Based on this recent event, numerically, I can see nobody better qualified than wattclarity to estimate the TWh of storage necessary for the East Coast of Australia.
Hi Jonathon,
There are no off-shore wind farms in Australia – and only a couple mooted at this point. We don’t currently have access to off-shore wind speed data either. Hence sorry we can’t help on this.
Thanks for the kind words, by the way. In terms of battery storage, you might find our other site of some value:
http://www.batterystorage.info/
Paul
Dear Paul
It goes without saying that there are no off shore wind farms in Australia.
I am surprised to hear that wattclarity do not have access to off shore wind data.
The storage site referenced is not practical.
Kind Regards
Jonathon Sarah
When we say global warming causes climate change, what that actually mean is climate belts shift. Regions between 30° – 45° will see climate shift by 100-150km per degree of warming. If climate belt has associated wind elements, in the southern hemisphere, these will be moving southwards.
In other words the roaring 40s become the roaring 42s.
Climate belt shifts generally aren’t linear, but rather occur as a step change – a great example of step changes in climate is found in the drying of sw WA and loss of stream flow – https://twitter.com/ProfRayWills/status/877335681038655488
Step changes are of course also points on a bell curve – perhaps this is the first iteration of moving wind resource, and we should expect to see more. In the longer term as climate belts shift, some wind farms may be at risk of being left behind…