Queensland LNG exports are now in full swing. At the time of writing (18 December) QCLNG has exported 79 LNG cargoes comprising 5.2 million tonnes (Mt) of LNG since the first cargo in January 2015. This has used 303 petajoules (PJ) of gas. The second QCLNG train commenced production in early July and the two plants are now operating at plateau production of around 8 Mt per annum (Mtpa) on an annualised basis.
The second project, GLNG, started Train 1 production in October and has now shipped six cargoes. It is taking slightly longer to ramp up than QCLNG. First LNG from Train 2 is expected in second quarter 2016. The third project, APLNG, started LNG production on 11 December with the Magellan Spirit LNG carrier currently loading the first cargo.
There is currently much focus on the impact of the Queensland LNG projects on the electricity market in Q1 2016, a time when Queensland power demand often peaks.
The LNG projects affect the electricity market in two ways. To the extent that there is excess gas, this pushes down power prices and makes gas more competitive for power production (and vice versa). Also, the most of the new upstream gas processing plants are electrified, increasing electricity demand as production ramps up. Estimates of the likely increase in power demand vary but are generally assumed to be 400-500 MW now, increasing to a plateau of 1,000-1,200 MW.
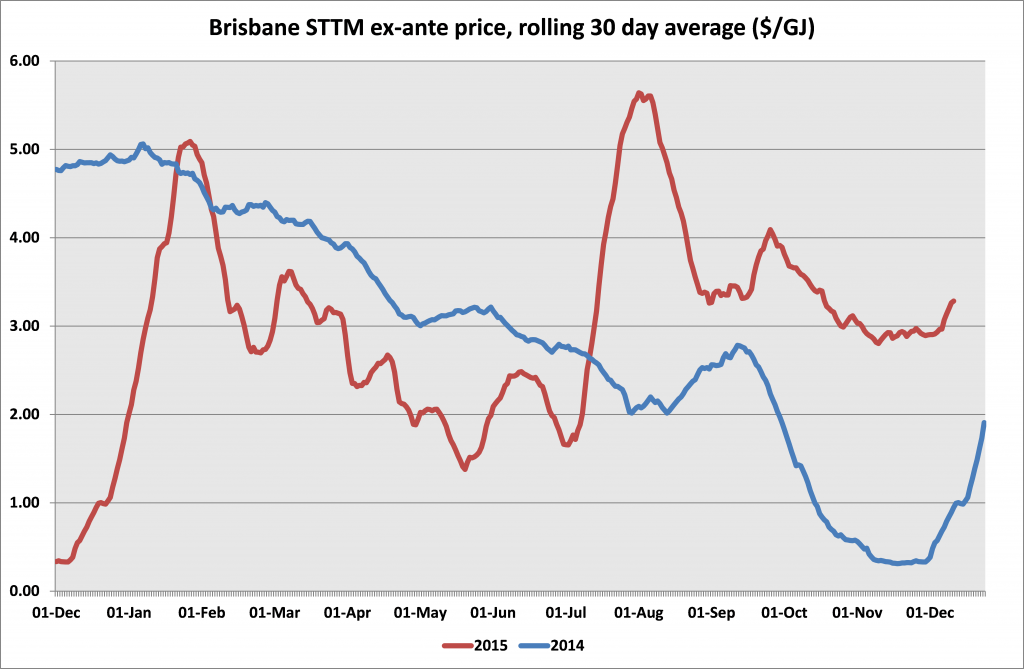
Figure 1

Source: AEMO
At the macro level, the impact of the LNG projects on the gas price in the Brisbane short-term trading market so far has been moderate, suggesting that demand and supply are reasonably balanced. Figure 1 shows rolling thirty day average ex ante gas prices from the Brisbane STTM. The build-up of gas ahead of first LNG production at the end of 2015 reduced gas prices and there were spikes with the start-up of QCLNG Train 1 and Train 2.
The start-up of GLNG and APLNG appears to have led to some market tightening, but not to the same extent as with QCLNG.
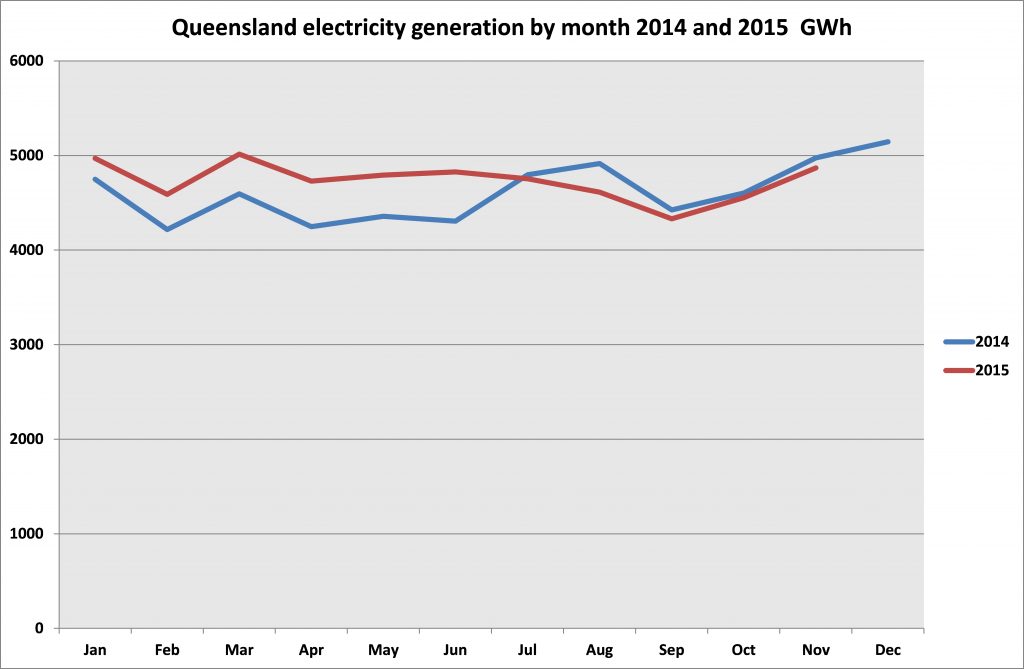
Figure 2

Source: AEMO
At least so far too, the start-up of the LNG projects does not appear to have been associated with a significant increase in Queensland power demand, which is running close to 2014 demand (Figure 2). If it has done so, there must be other offsetting factors at work.
What about at the level of the individual LNG projects?
As at 18 December the QCLNG pipeline is delivering 1,507 TJ, not too far short of its 1,530 TJ capacity. For the first two years QCLNG has the benefit of the APLNG equity share of gas from their joint fields, Kenya, Ruby Jo and Bellevue. Currently the total QCLNG pipeline nominations at 1,507 TJ are higher than production from its operated fields of 1,343 TJ, with the difference being met from storage or third party contracts so there is no sign that QCLNG has excess gas available. Berwyndale South and Kenya are not electrified but Ruby Jo, Bellevue, Jordan and Woleebee Creek are. The electrified plants are currently producing 1,095 TJ compared with total capacity of 1,625 TJ. Production from the QCLNG electrified plants will need to increase when the current gas supply contract from APLNG winds down around the end of 2016.
The GLNG pipeline is delivering 596 TJ against capacity of 1,430 TJ. There is no sign that GLNG has excess gas. Fairview is producing 385 TJ gross and Roma only 16 TJ. The difference is coming from Moomba, storage and third party contracts. Fairview has capacity of 540 TJ/d, of which 410 TJ/d is electrified. As Fairview ramps up for Train 1 GLNG electricity demand will increase.
The APLNG pipeline is delivering 400 TJ compared with capacity of 1,560 TJ but ramping up quickly, with a forecast of 690 TJ by next week. Current pipeline nominations are below production of 706 TJ from APLNG-operated fields. The difference appears to be being supplied to the other projects, plus meeting Origin’ domestic demand. The older APLNG plants, Spring Gully and Talinga, are not electrified but the Condabri, Combabula, Reedy Creek, Orana and Eurombah Creek are electrified. Currently the electrified plants are only producing 526 TJ out of capacity of 1,350 TJ. These plants have further to ramp up in supplying Train 1 but the significant increase is more likely around the middle of next year when Train 2 comes into operation.
So, what if any, are the implications for Queensland electricity demand in Q1 2016? There will be some increase in power demand driven by the LNG plants, notably the ramp-up of Fairview to full capacity and the ramp-up of APLNG Train 1. However the more significant impacts are likely to be later next year as the GLNG and APLNG second trains start producing and in Q1 2017 when the two-year APLNG contract with QCLNG expires and QCLNG’s plants ramp up.
About our Guest Author
| Graeme Bethune is CEO of EnergyQuest, a company he founded in 2005.
EnergyQuest is an Australian-based energy advisory firm, which specializes in energy market analysis and strategy for energy companies and buyers, investors and governments. Its work includes oil, gas, power, LNG, unconventional gas, pipelines, conventional liquid fuels and alternative liquids. It provides market monitoring through its Energy Quarterly and other multi-client reports and also consulting services. It works with major energy companies, energy buyers, governments and investors. You can find Graeme on LinkedIn here. |


Be the first to comment on "What impact are Queensland LNG exports having on Queensland electricity markets?"