
Now that legislation has passed through Parliament, and the Government works to implement the required regulations, it is timely to take a look at the Renewable Energy Target (RET) and how we got here. A post mortem of sorts.
As a policy, the RET has a pretty poor track record. Since its inception in 2001 the RET has spent more time under review than free of reviews. That has been made worse as each review has struggled to be fully implemented before the next review gathers pace.
Along the way we have seen the original target expanded to take over from state-based schemes, artificial multipliers to encourage uptake of certain technologies, splitting the scheme between small- and large-scale to limit cross-technology competition, and a disconnect between costs of permits and technology.
Other ‘highlights’ have included some woefully inaccurate modelling of electricity demand and rate of uptake of rooftop solar that has meant the policy’s impacts are seriously at odds with its designer’s intent.
For anyone whose business is materially impacted by RET – and that includes major electricity users as well as renewables investors – it has been an eventful joyride. It has created a situation where all players seek changes to the rules to resolve their “anomalies” while also seeking stability in the scheme.
If the most recent stage of the RET joyride – the Warburton Review and subsequent negotiations – started in the land of good policy (and that’s a big ‘if’ for people on both sides of the debate), it certainly didn’t spend long there before passing briefly through politics and arriving in a strange place of personalities and brinksmanship.
At a glance, the RET targets appeared to be an orderly increase in the requirement for large-scale renewables (LRET), building off the base provided by the original MRET and “shandied” with the contribution from the small-scale scheme (SRES).
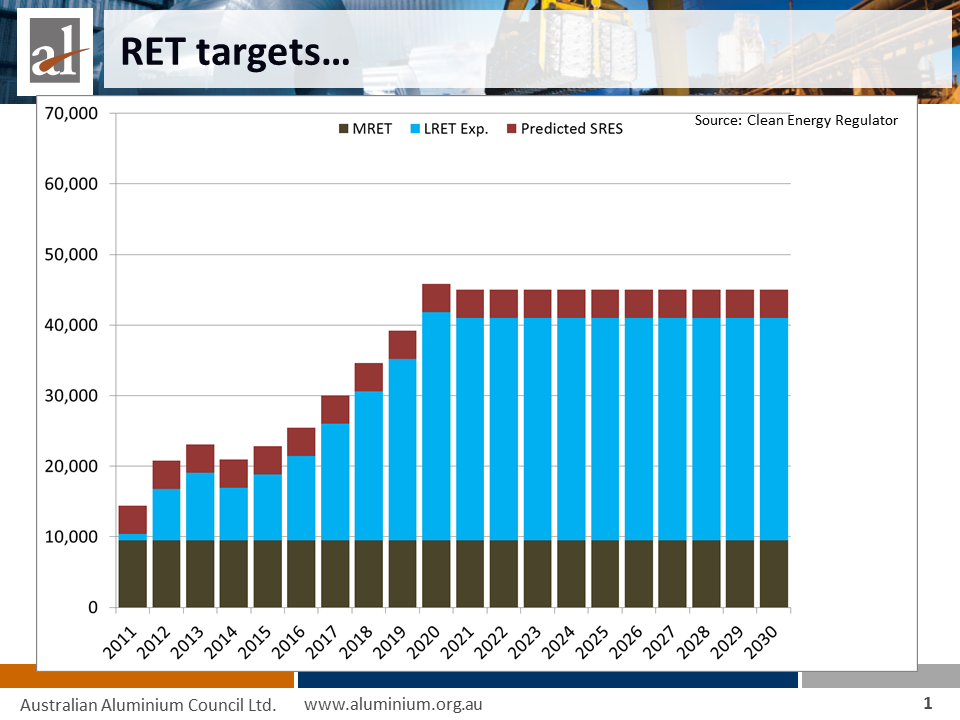
What that orderly graph hid was the extent the policy would have overshot the initial intent of “20% renewables” due to declining electricity demand, and the overheated level of activity brought on by the small-scale scheme (compounded by State incentives).
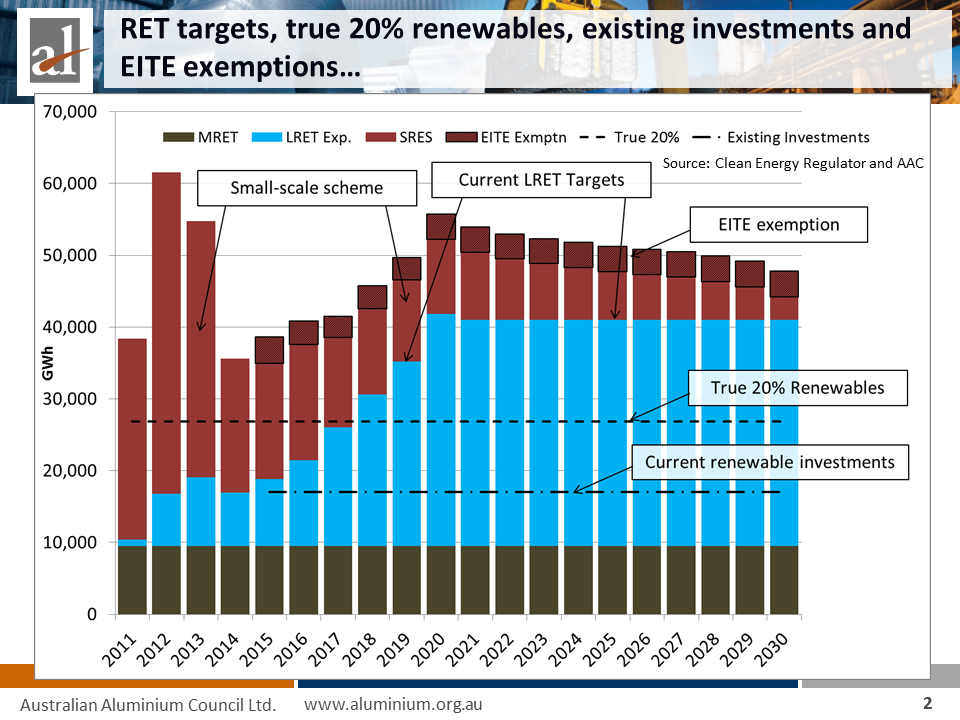
The graph below is a truer reflection of RET prior to the changes of 2015.
Editor’s Note
It’s our understand that this second graph shows (for prior years) actual aggregate STCs created each year from the SRES scheme, hence reflects two significant factors:
1) that small-scale systems (under SRES) are credited with assumed “lifetime” production of energy up-front; and
2) for 3.5 years a multiplier was applied to the STCs that would normally have been created – as follows:
June 2009 – 30 June 2011 = multiplier of 5
July 2011 – 30 June 2012 = multiplier of 3
July 2012 – 31 December 2012 = multiplier of 2
January 2013 – onwards = multiplier of 1 (i.e. reduced back to unity 2.5 years ahead of schedule)
The LRET target alone – 41,000 GWh from 2020 – would have delivered more than 25% renewables. On top of this, the small scale scheme (SRES) was delivering many multiples of the estimated 4,000 GWh and would continue to do so despite some of the heat being taken out of that market through reductions in the multiplier.
The Warburton Review (linked here, whilst it’s still available) – or more correctly the Ministers and Shadow Ministers who negotiated the outcome, and in doing so, rapidly moved on from the recommendations of the Warburton Review – had these realities to deal with, along with a strident campaign from the solar industry built around popularity of rooftop panels with voters and a (surprising for some) suggestion from the modelling that RET was exerting downward pressure on electricity prices.
It prompted the question from some – if the technology needs a subsidy because it is more expensive, how is it driving prices down? That prompted the answer from others that it is the result of forcing new generation into an oversupplied market and the losers may be the owners of existing capacity in the short-term and consumers in the longer term.
Electricity-using industry – like aluminium smelting – had plenty at stake as well. Aluminium smelters have attracted costs of more than $500 million since the RET commenced and this was slated to grow at a further $70-80 million per year.
This cost wasn’t for a structural change in our electricity supply or for any Good or Service that we used, as aluminium smelting relies on continuous base-load power of a type that the RET was not instigating. It was a simple transfer of money from what might have been profits for our businesses (were market conditions better) to create profits for renewable energy businesses.
The extent to which we felt the pain of RET (and any policy that impacts electricity prices) can be seen in the graph below.
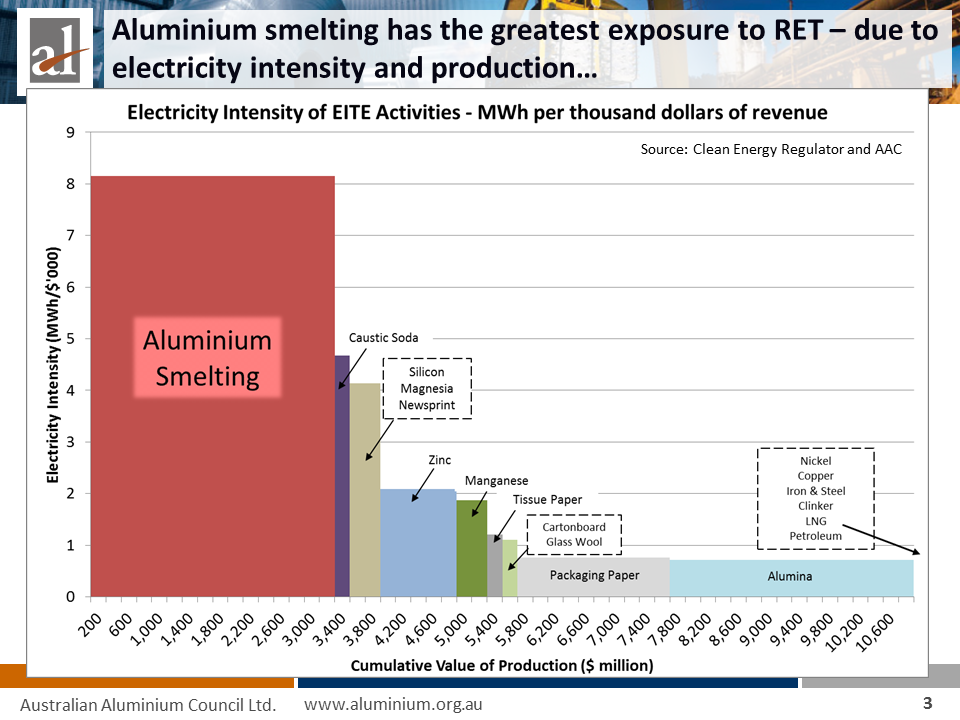
On the vertical axis is the electricity-intensity of the industry – the higher the column the greater electricity costs are as a proportion of total costs, and the more exposed that industry is to electricity prices.
On the horizontal axis is the total value of production – the wider the column, the more of that activity we do in Australia.
The total size of each ‘block’ is a measure of how much electricity is used in that industry and the likely amount of any electricity-related cost that is being paid.
It is easy to see why RET was a hot topic for the aluminium industry, and why other industries also had a strong interest (many of them with operations in Tasmania, attracted there years ago by reliable, efficiently priced electricity).
So as these positions and forces came to bear, some early indications appeared in the negotiation process:
- The recommendations of the Warburton review had less impact than expected;
- The rooftop solar campaign came early and hard;
- Downward pressure on electricity prices from RET became the accepted reality;
- The policy intent of “20% renewables” became subservient to the target of 41 000 GWh, rather than the reverse;
- Exemptions from RET costs for trade exposed industry received support from (almost) all sides of politics; and
- The case for a reduction in RET targets beyond that needed to provide an exemption to trade-exposed industry failed to gain much traction.
So agreement was quickly reached on elements such as: no change to the small-scale scheme; exemptions for emissions-intensive trade-exposed industry; and an end to two-yearly reviews (or so we thought).
The negotiation narrowed in on the level at which the LRET target would plateau after 2020. The Opposition started at the existing target of 41,000 GWh, the Government started at 27,000 GWh. Negotiations broke down.
The Opposition moved to mid-high thirty thousands, the Government moved to thirty thousand. Negotiations broke down.
The Government moved to 32,000 GWh, the Opposition moved to 35,000 GWh. Negotiations broke down.
It seemed inordinately difficult and time-consuming to reach a deal on a number that was jarringly obvious to most observers. The mid-point of the opposing positions at each point that negotiations broke down was around… 33,000 GWh.
A critical question around the future target was the achievability of investment and construction to meet the target. If the target couldn’t be built, certificate prices would rise to the penalty price and the worst outcome would be delivered – higher electricity costs without the benefit of investment.
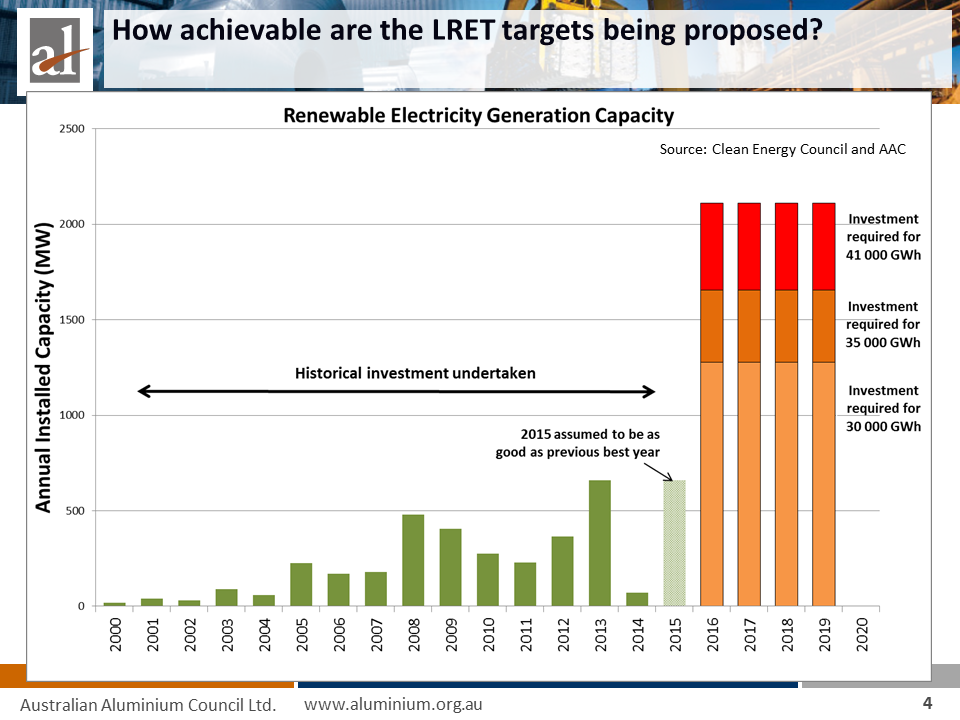
When the investment required to meet the range of targets was compared to historical investment (as in the graph below) a number of conclusions relevant to the negotiation become apparent.
Editor’s Note
It’s our understanding that historical capacity factors were assumed forward into four future years to translate each year’s incremental GWh target back to MW installed capacity
The graph suggested that the Government (and the rest of us) had good reason to be worried about whether any of the proposed targets could be built. Assuming 2015 equalled the best year on record, then the next four years had to be double the previous best or more. Though it should be noted the task has not been helped by the 2014 lull in investment that resulted from the review itself.
It is also clear that even the lowest of the proposed targets was not going to kill investment and would, in fact, require four spectacularly good years of investment for the renewables industry.
And ultimately it led some to question whether the calls for higher targets came from those keen to invest or build or from those with an interest in high certificate prices or political outcomes.
Ultimately, sanity prevailed (or insanity, depending on your preconceived views). A deal was reached that included:
- An LRET target of 33,000 GWh from 2020;
- No changes to the small-scale scheme;
- Full exemptions for emissions-intensive trade-exposed industry;
- Removal of scheduled two-yearly reviews (despite a late hiccup).
The major parties held to historical views on the inclusion of native forest wood-waste (Government for, Opposition against) that also enabled some final fiery arguments in the Senate.
So through the good efforts of many individuals, and despite a number of significant setbacks along the way, the RET now seems to have a more solid and durable base than for most of its past.
But beware the lessons from history. This is a policy that has rarely sat stable for more than a few months. There are clearly strong and opposing views still held within Parliament and indeed within each major party.
Labor has indicated that it views the 33,000 GWh target as a minimum and is likely to take an increased target as part of its platform to the next election.
The RET joyride, that has proved so eventful thus far, may well have a few more twists, turns and hurdles to serve up yet.
Editor’s Note
Miles Prosser spoke on this topic at the EUAA Queensland Energy Forum in May – in a session that also included a presentation by Nigel Morris on “the Solarcoaster ride” (which Nigel later wrote about on WattClarity here).
Given the wide-reaching implications of policies in this space both of these speakers were invited to post their thoughts on WattClarity.
About our Guest Author
|
|
Miles Prosser is the Executive Director of the Australian Aluminium Council, the peak association for the bauxite mining, alumina refining and aluminium smelting industry sectors.
Miles has twenty years experience in industry policy issues. He has previously worked for the pulp & paper and forest industries on a range of issues relating to resource allocation, sustainability and climate change. Miles has experience in the development and implementation of policy from the perspective of Government, resource suppliers, major processing companies and industry associations. The priorities of the Australian Aluminium Council include an effective response to climate change, energy policy and the reputation of the aluminium industry and its products. You can find Miles on LinkedIn here. |

The renewable energy advocates have blocked substantial progress on cutting CO2 for the past 20 years and are continuing to do so. Locking in the RET will delay substantial progress for another 20 or 30 years.
Renewables cannot have much impact on cutting global GHG emissions: http://www.onlineopinion.com.au/view.asp?article=17447
http://euanmearns.com/the-difficulties-of-powering-the-modern-world-with-renewables/
http://bravenewclimate.com/2015/06/05/less-than-the-sum-of-its-parts-rethinking-all-of-the-above-clean-energy/
http://bravenewclimate.com/2014/08/22/catch-22-of-energy-storage/.
Only nuclear can have a substantial on cutting the emissions intensity of electricity. Anyone who has crunched the numbers knows this. Rational analysts have know this and have been showing it for at least the past 25 years. But the RET is forcing renewable capacity into our market and it will block the possibility of substantial emissions reductions from electricity for 20 or 30 years. Even once the public and voters see through the renewable energy ideologue’s dogma, it will take another 20 to 40 years for the impact of the irrational policies that have incentivised renewable energy to wash out of the system. That’s how much damage the green ideologues are doing. They either don’t realise or don’t care.
“How much does it cost to reduce carbon emissions? A primer on electricity infrastructure planning in the Age of Climate Change” (see Slide 10, and note the irony in slide 14 (this is what the RE advocates are unwittingly advocating for):
http://canadianenergyissues.com/2014/01/29/how-much-does-it-cost-to-reduce-carbon-emissions-a-primer-on-electricity-infrastructure-planning-in-the-age-of-climate-change/
Miles Prosser,
Thanks you. Excellent post. Very informative. From my perspective, the sooner governments sot trying to pick winners (e.g. pro-renewables, anti-nuclear, market interventionists) the better for everyone (other than who like to live off government imposed subsidies).
Would you be happy if nuclear was included in the RET?
Perhaps I’m missing something, but there seems to be a problem with the final figure.
Since 2005 (but excluding 2015), Australia has installed over 4 GW of PV, and just under 4 GW of wind. That’s an annual average installment rate of about 400 MW each, or 800 MW in total.
The columns in that chart are clearly much less than this (perhaps 300 MW average?). Even it it excludes PV, it still seems to be wrong.
The columns in the chart are only for large scale and add up to just short of 4 GW through to 2015 so the numbers tally fairly well to your figures.