
Demand and Supply Side Forces
“Over the next five year period we expect to continue to witness a range of fundamental changes across the NEM – both on the supply and demand side. In September 2013 we submitted this article which examined the changing role of gas on the supply side of the equation. This article explores a fundamental change which is being witnessed on the demand side – a significant reduction in demand growth by the industrial sector.”
2.0 Historical Perspective
2.0.1 Historical Years
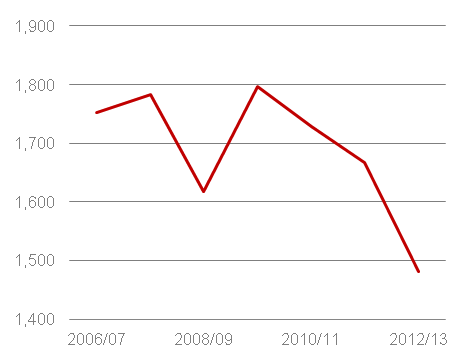
Over the past four years (and beyond), the majority of electricity forecasters have been assuming a compounding growth in electricity demand, across residential, commercial and industrial sectors, when actual demand has in fact fallen. As an example, the following chart compares actual NEM demand and forecasts included in historical ESOO, prepared by AEMO.
Figure 2.1 Comparison of ESOO Forecasts and Actual Historical Energy Consumption | GWh
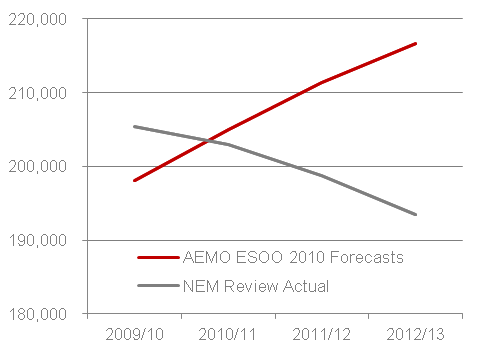
Source: NEM-Review, AEMO ESOO 2010.
This chart highlights a variance of 3.7% p.a. on a CAGR basis over a four year period or a discrepancy of 23,076GWh in energy consumption forecast by 2012/13.
2.0.2 Current Forecasts
The latest AEMO ESOO, published in 2013, included the following projection of demand, which represented a CAGR of 1.2% for the NEM as a whole and 2.1% for industrial alone.
Figure 2.2 AEMO ESOO 2013 Energy Consumption Forecast | GWh
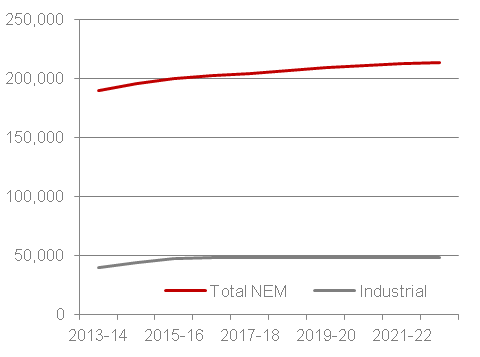
Source: AEMO ESOO 2013, AEMO NEFR 2013.
Whilst some new demand, associated with LNG power demand, is accepted by the author, it is difficult to see that this level of growth is sustainable.
2.1 The Change in Industrial Sector Demand
It is the authors’ view that the majority of forecasters have not invested adequate time to understand the reality of change taking place at the industrial customer segment ‘coal face’. The reality is that there is a revolution underway. Traditional larger scale industry and the manufacturing industry in particular are experiencing a range of complex pressures (exchange rates, labour and other input costs, energy efficiency pressures and changing resource extraction costs) which will lead to material demand reduction over the next five years.
2.1.1 Alcoa – Point Henry Case Study
Alcoa recently announced the closure of its Point Henry facility which is due to cease operations in August 2014.
The aluminium plant has an on-site power station – Anglesea Power Station, a brown-coal power station of 150MW capacity, which contributes around 40% of the smelter’s power requirements. The remaining power is purchased under contracts with the State Electricity Commission of Victoria (“SECV”) that are due to expire in 2014.
In March 2010, Alcoa secured an energy contract for approximately 820MW of load with Loy Yang Power to replace the contract expiring in 2014.
Point Henry smelter has historically consumed approximately 2,500-3,000GWh of electricity per annum. Anglesea Power This equates to 5.4 -6.0% of total Victorian energy consumption and approximately 1.3% of total NEM demand in 2013.
The following figures present the energy consumption by Point Henry smelter and its breakdown by supply source.
Figure 2.3 Point Henry: Annual Consumption | GWh
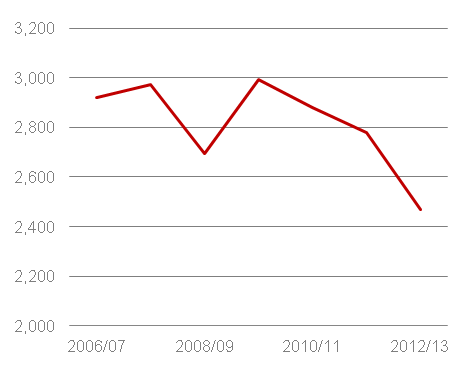
Source: NEM-Review, Alcoa Annual Report 2012.
Figure 2.4 Point Henry: Annual Supply from Anglesea (LHS) Power Station and
Figure 2.5 Point Henry: Annual Supply from SECV | GWh (RHS)
(assuming supply symmetry)
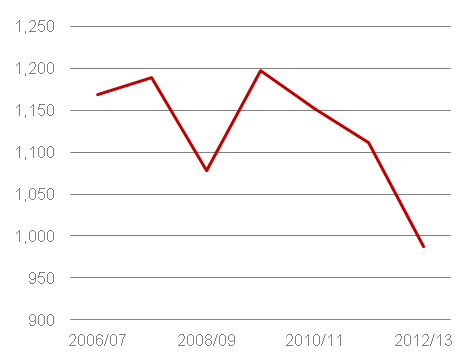
Source: NEM-Review
2.2 Implications and Outlook for the NEM
It is beyond the scope of this article to analyse the implications of this demand trend, rather I seek to highlight a few areas which deserve comprehensive analysis – perhaps comments from readers:
· Price Implications – what impact will increased supply capacity have on future price?
· Should Government consider buy back of capacity?
· Fuel Mix – increased coal capacity will increase competition against gas and other supply sources?
· The Role of RET – It is important that we fully understand the cost of adding capacity to meet RET targets at a time when we are seeing demand side growth challenged?
About our Guest Author
 |
Paul Taliangis is the Adelaide-based CEO at Core Energy Group.
Core Energy Group is a specialist energy advisory firm with a particular focus on gas, LNG, power and infrastructure elements of the Australian energy industry value chain. Further background to Paul can be found on Paul’s LinkedIn profile. |
Alcoa, Annual Report 2012, March 2013.
Alcoa, Sustainability Report 2010
Energy consumption values from 2006 to 2012 have been validated against Alcoa’s sustainability reports.
Leave a comment