[posted at 15:10 NEM time]
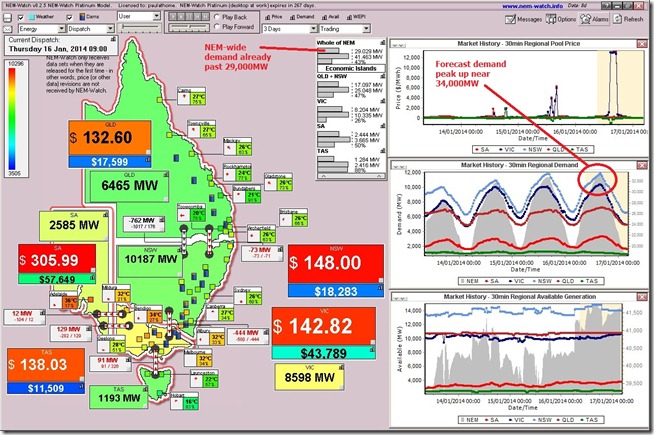
Following on from Tuesday 14th and Wednesday 15th January, it was not much of a surprise to see (this morning) the AEMO issue another Lack of Reserve notice for the Victorian region for later this afternoon – again sent in automatically with Local Alarms set in a display copy of NEM-Watch running in our office.
The text of message published at 09:43 (NEM time) was as follows:
Notice ID 44617
Notice Type ID RESERVE NOTICE
Notice Type Description MARKET
Issue Date Thursday, 16 January 2014
External Reference PDPASA Forecast Lack Of Reserve Level 2 (LOR2) in the Victoria Region 16 January 2014.
________________________________________________________________________________________________
AEMO ELECTRICITY MARKET NOTICEPDPASA Forecast Lack Of Reserve Level 2 (LOR2) in the Victoria Region 16 January 2014. AEMO declares a LOR2 condition for the Victoria Region. From 1400 hrs to 1630 hrs 16 January 2014
The contingency capacity reserve required is 500 MW The minimum reserve available is 260 MW
AEMO is seeking a market response.
[A LOR2 notice means that there’s forecast to be just enough available supply to meet demand – except if a large unit should trip, or an interconnector trip, or some other contingency. So it’s not as serious as the one issued yesterday]
We saw this morning that the demand peak forecast for this afternoon followed the same pattern as Tuesday and Wednesday – with the forecast NEM-wide demand being even higher than that experienced in the previous couple of days – as shown in this snapshot of 09:00 from NEM-Watch:
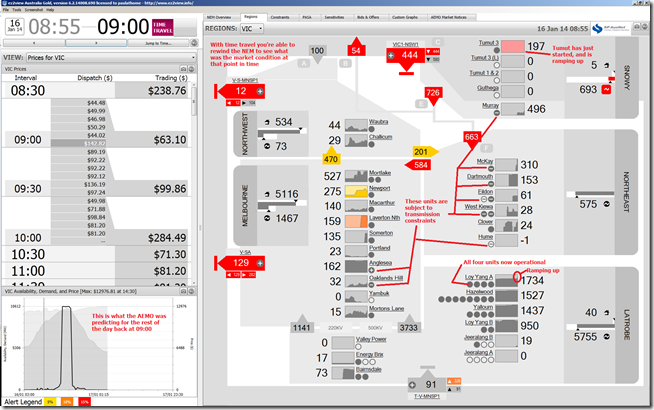
In a piece of good news, we noted that Unit 3 at Loy Yang A returned to service this morning, as shown here in this snapshot at the same time from ez2view in Time Travel mode (return to service was slightly earlier):
The outage at Loy Yang A, and also a unit out at Pelican Point (oops – Torrens Island!), had contributed to the tight supply/demand balance – which was then compounded by the lack of wind. This created upward pressure on prices, hence encouraging some Demand Side Response.
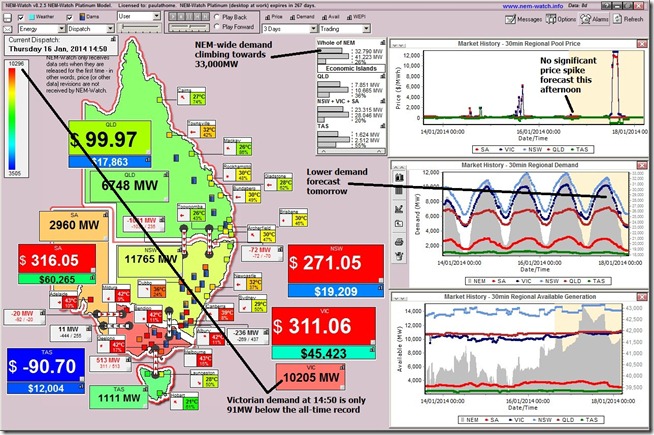
Today we see that (as above) all four units are running at Loy Yang A, and all eight at Pelican Point (oops – Torrens Island!) – plus the wind is contributing in South Australia (less so in Victoria). What this means is that (as shown in this updated snapshot from NEM-Watch at 14:50) the price spikes that were forecast earlier have been revised downwards:
Incidentally, the view of the NEM at this time shows Victorian demand approaching on the all-time record, which was set just before Black Saturday in summer 2008-09.
It may be that, in the absence of a price signal to incentivise significant demand side response this afternoon (unlike yesterday), we see the demand continue to climb this afternoon to set a new record.
Let’s check back later to see what happened…


all eight at Pelican Point?
Apologies, Interested Observer – must be too much going on at present!
Error #1 – meant to type Torrens Island, which actually does have eight units. Have noted above.
Error #2 – one of our other readers has pointed out that the peak demand on 29th january 2009 was actually 10,496MW as we showed back then in this post. Will update image above also.
The arrow to Anglesea as having a transmission constraint is surely in error. It has its own 220 kV line to join the grid at Geelong. Surely the arrow is meant to go to Morton’s Lane. This wind farm shares the same 66 kV line to Terang, where it joins the 220 kV network. However today there would be plenty of local demand from the 66 kV line, with air temperatures of 42 C in the Western District. I work in the area, and our poor air-conditioner at work was blowing out air at 41 C !
It is interesting to note that Morton’s Lane Wind Farm consistently has a higher capacity factor than either Oaklands Hill or MacArthur, even though it shares essentially the same wind resource. Morton’s Lane is not located on a noticeable prominence – perhaps it’s simply better design and operation.
PS. Morton’s Lane shares the same 66 kV line as Oaklands Hill, and is subject to constraints, whereas the MacArthur Wind Farm feeds the 500 kV line to Portland, and does not have transmission constraints.
Hi Malcolm
Thanks for all the comments the past couple days (and the compliment).
I have made a couple errors today, but the bit about Anglesea being subject to constraint is now (oops, not) one of them. The “+” symbol on the display for that station (and the “-” for the AGL Hydro plant) means that they are subject to a bound constraint – at this time it was the one AEMO calls “V>>SML_NIL_1”.
AEMO provides the following as the reason for the constraint “Avoid overloading Ballarat to Moorabool No.1 220 kV line for loss of Ballarat to Elaine to Moorabool 220 kV line and Mt Mercer Wind Farm” – the user can drill into the constraint in ez2view to get this detail.
The “+” symbol for Anglesea means that the constraint is (slightly, because of a low positive factor) trying to wind the output of the station down.
Does this help?
Paul
Hi Paul. Great stuff. I’ve been reading lots about how much solar pv has contributed to keeping the peak from going higher. Any thoughts on this?
Thanks James,
I did reference Kerry’s analysis in this post on Saturday, which was more directly to do with Demand Response.
Paul