Following on from our recent post looking at the performance of wind farms over the course of the first 7 months in 2013, the obvious question that occurred to us was to wind the clock further backwards in time to see how performance has trended up over the past 8 years (there is less data available prior to this point, and volumes were low in any case).
1) Wind Farm energy output steadily increasing
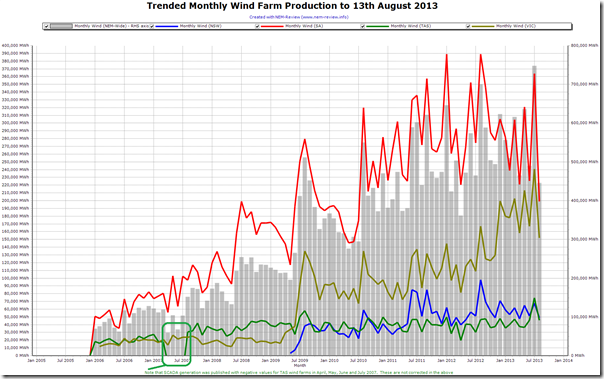
Again using NEM-Review, we generated the following trend – with data aggregated on a monthly basis to make the trend a little clearer:
In this chart, we can see some distinct seasonality of output, with output tending to peak in the winter months.
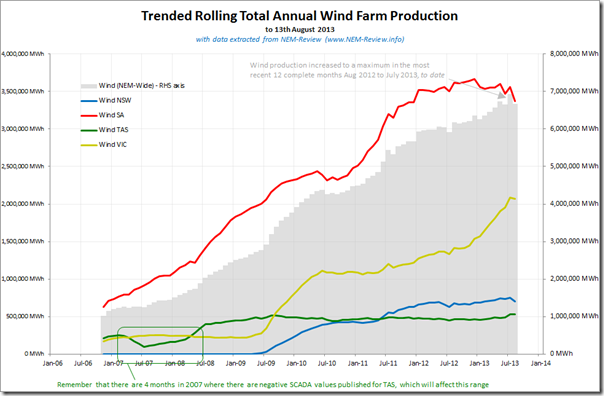
Taking the data and generating a 12-month rolling aggregate, it becomes clearer that the annual output from wind farms across the NEM has been trending upwards and reached its highest point yet in the twelve months finishing 31st July 2013:
2) Rising share of demand consumed
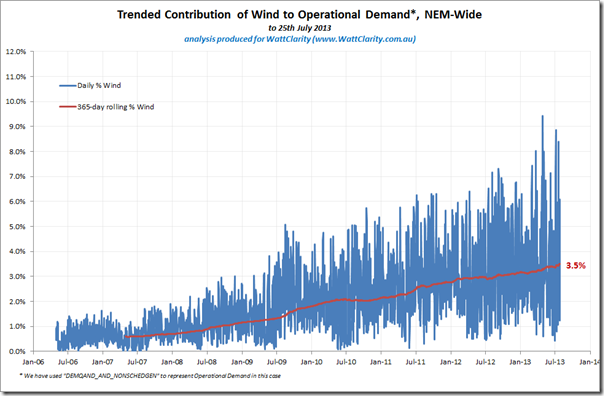
Taking into account the “DEMAND_AND_NONSCHEDGEN” data from AEMO (which, we believe, is the best data set equating to what AEMO terms “Operational Demand”*) and comparing with the rolling annual wind farm output (NEM-wide) we produce the following trend:
* For more information about the AEMO’s definition of demand, see here.
As can be seen, the percentage supplied by wind has risen steadily to be at 3.5% currently – but that there remains (and appears to be growing) a significant variability in the percentage supplied on a daily basis.
We chosen not to show this ratio on a regional basis as, in our view, that would be a vanity metric and not one that serves as useful a purpose as looking market-wide.
3) But remaining intermittency, despite broader spread of installations
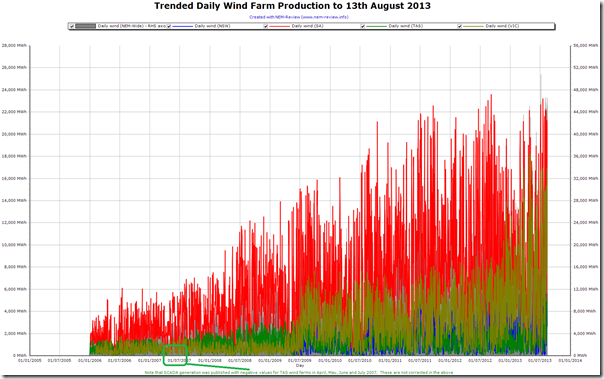
Next, we extended the 7-month-long daily production trend shown in this recent post to span the full range for which data is available and in the following it is clear that, whilst the peak daily outputs have increased considerably over the past 8 years, there are still a significant number of times when the market is becalmed.
This chart confirms that it was only on 4th July 2013 that the total energy generated from wind exceeded 50,000MWh for the first (and, to date, only) time across the NEM. We can see that the volume generated has progressively increased (year-on-year).
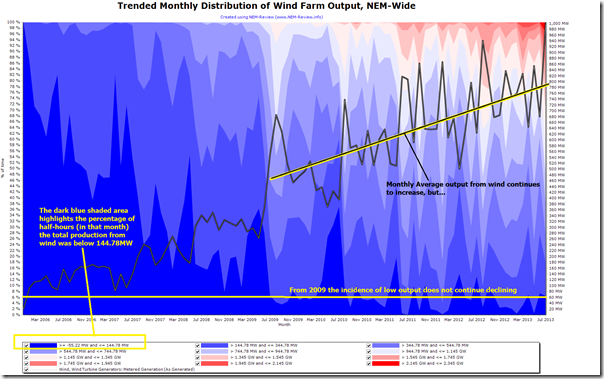
The noise in the above plot is highlighted on a monthly basis in the following distribution curve generated from NEM-Review:
As shown in this trended distribution curve, despite the fact that the energy generated by wind farms across the NEM has continued to grow over time, the incidence of time when wind output falls to very low levels has not significantly declined over the past four years.
This is despite the fact that wind farms were introduced to southern NSW in mid 2009 (i.e. so the theory is that different weather patterns would mean they’d be producing when wind farms in South Australia were not).
More on this topic later…


This is interesting analysis. Thank you. What would also be interesting to see is the minimum aggregate average power output (MW) from wind generaton in a 5 min trading interval for the year and some sort of frequency analysis, such as aggregate wind generation was X MW or above 90% of the time and y MW or above 50% of the time for the year.
Thanks for the suggestion, Tagent
I will have to save that one for another post!
Regards
Paul
Hi, So what you are essentially saying is that the variability of the weather patterns over the last 4 years that the increasing number of wind farms in the NEM are operating in has not changed much.
Hi Muzz
It seems that weather patterns in the expanding area over which wind farms have been installed, thus far have not been sufficiently asynchronous to reduce the small but significant percentage of time when the entire portfolio of wind assets have produced a negligible amount.
Does this help?
Paul
Of course, the vast majority of the energy is coming still coming from SA and Vic, which have relatively strongly-coupled weather patterns, and most of the wind generation in NSW is concentrated in one area close to the Vic border.
What might be more useful to say here is that wind power is generated by “useful” weather patterns, and as long as wind farms are installed based on economic gain, the most useful wind patterns will continue to be exploited and improved reliability resulting from the geographical diversity of generation will not be realised.
The story becomes interesting when network limitations prevent wind farms from being installed in areas with the best weather patterns – we are approaching that situation now, and it is likely that as long as network augmentations designed specifically to “unlock” wind resources do not go ahead, that we will observe an increase in geographical diversity of wind generation (because the economic gain to the wind farm owner will be reduced under conditions of network congestion).
Thanks for the comment, Quadranum
I’m sure the economists have a technical name for the behaviour you observe – wind farm developers maximising the benefits to themselves (in terms of locating where they will get maximum MWh generation, and so also RECs) but not having an incentive (yet?) to consider where diversity would be promoted.
With new planning restrictions in Victoria we’ll be interested to observe performance patterns as new wind farms sites further afield are opened up.
Paul