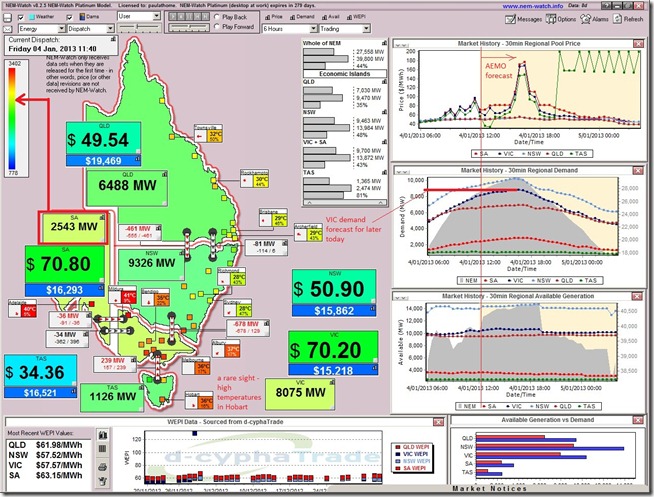
It’s not often we see temperatures above 35 degrees in Hobart, so here is one for the record (from NEM-Watch):
As can be seen in this snapshot from 11:40 NEM time, the demand in South Australia (2,543MW) is barely out of the green zone with reference to the maximum achieved historically.
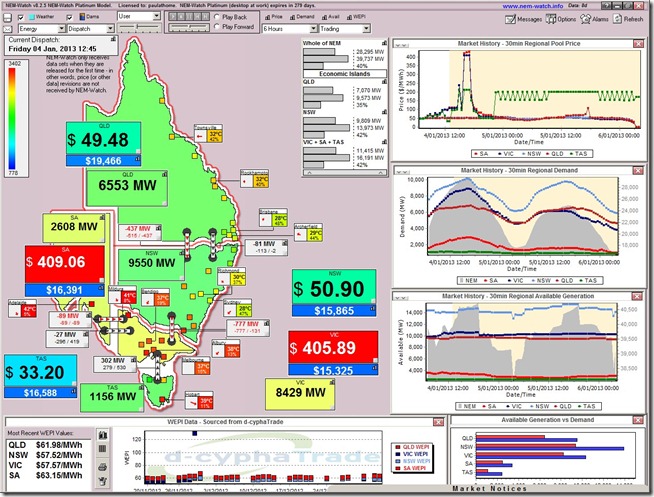
Sixty-five minutes later (at 12:45) and we see that the temperature has risen in Hobart to be 39 degrees, with a strong wind blowing from the North-West. As part if the hot weather steaming across the south-east, we see prices spike to the level equating to the short-run marginal cost of the most expensive peaking plant in the area (not much in between here and VOLL!)
Also note on the weather boxes the extremely low humidities which are part of the fire danger warnings posted by the BOM and repeated in articles like this one in the Age.
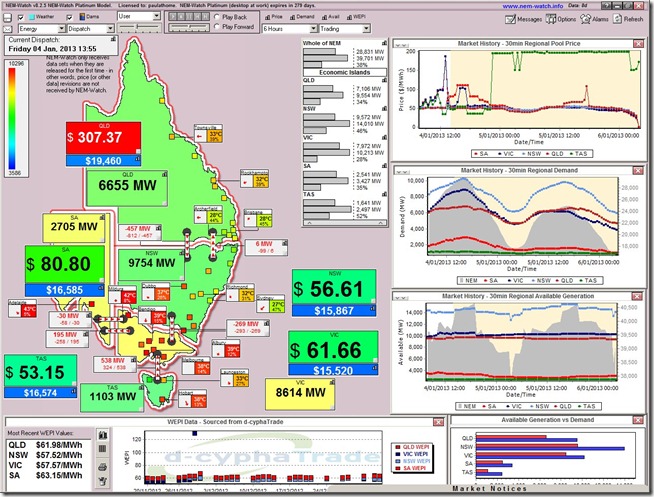
Another 70 minutes later (at 13:55 NEM time) and we see the extreme temperatures spreading further north, with some red dots appearing further into NSW. Demand in Victoria has climbed another 185MW fully out of the green zone into yellow (but still more than 1,500MW below the all-time record).
Also in this snapshot we see one of the recurrent price spikes in QLD occurring as a result of the 855-871 constraint.
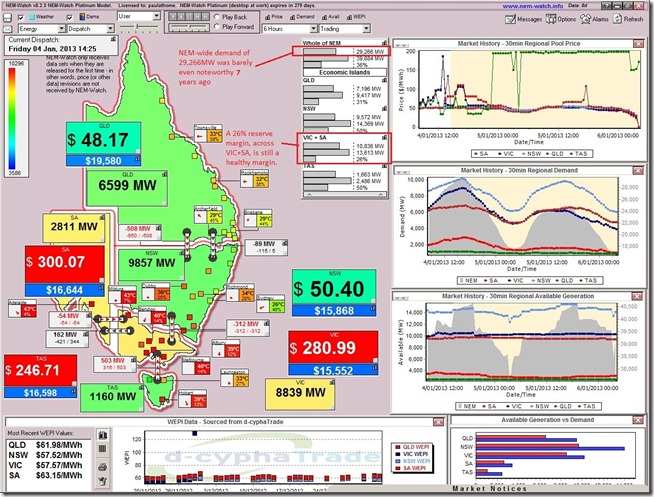
Another 30 minutes later (at 14:25) prices spike in all three southern regions, as shown in this NEM-Watch illustration:
We see how demand is up by a further 106MW in South Australia, and another 225MW in Victoria – however we also note that the NEM-wide demand (the focus of our “Best Demand Forecaster in the NEM” challenge for summer) has barely raised a sweat – at 29,266MW. As such, the NEM still enjoys a massive Instantaneous Reserve Plant Margin (IRPM) of 36%.
We also see that, due to the high demand – and transmission congestion in from NSW and TAS, the VIC + SA “Economic Island” has a lower IRPM (though it is still a healthy level of 26%).
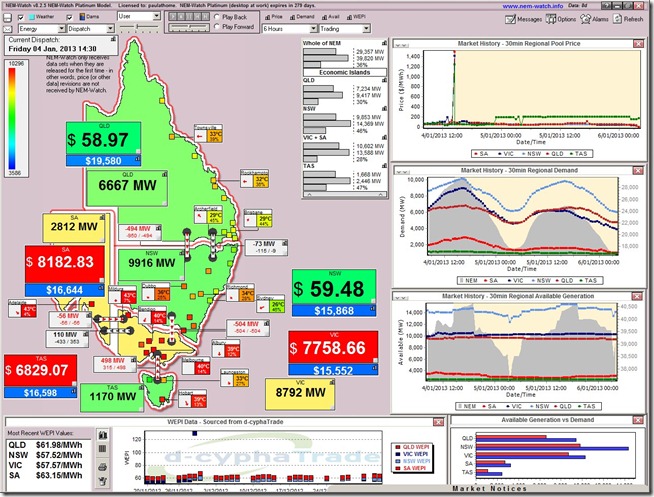
Despite this healthy margin, we see prices explode only 5 minutes later (at 14:30 NEM time) as shown in the following image:
From NEM-Watch we can extract the following AEMO Market Notice that explains the reason for the price spike:
MARKET NOTICE
________________________________________________________________________________________________
From
To
Creation Date
________________________________________________________________________________________________
Notice ID 40882
Notice Type ID GENERAL NOTICE
Notice Type Description MARKET
Issue Date Friday, 4 January 2013
External Reference Constraint automation to maintain power system security in Vic Region 04 Jan 2013
________________________________________________________________________________________________
AEMO ELECTRICITY MARKET NOTICEAEMO network analysis in the Vic Region indicates for the trip of a Rowville Yallourn 220kV transmission line would result in an overload of the remaining Rowville Yallourn 220kV transmission lines
AEMO has invoked automated constraint set CA_SPS_3FF8E592 from 1425 hrs to maintain power system security
Paul Ryan
Power System Operations Manager.
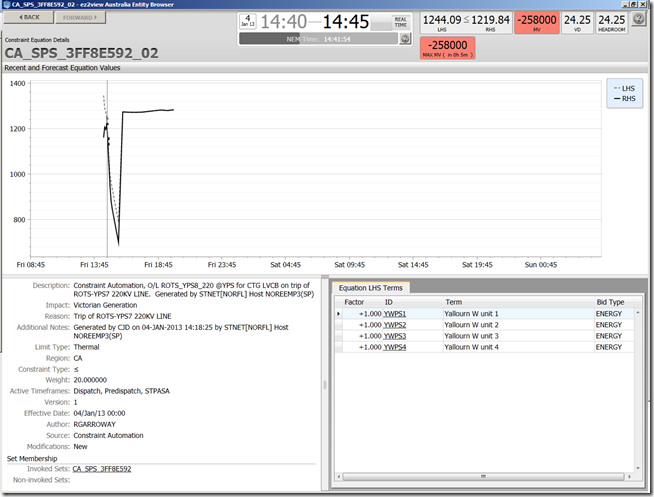
We use ez2view for a higher level of detail in order to drill into the particular constraint equations that have been invoked as a part of this set:
(call us on 07 3368 4064 if you want to know more about this one!)
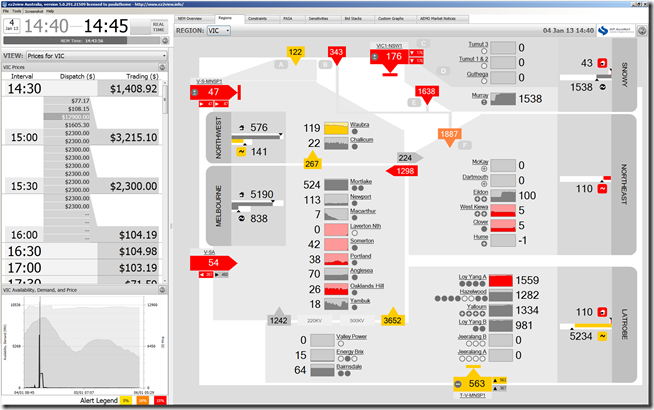
We can see (at 14:45 in ez2view) that the VIC price spiked to the Market Price Cap (still known colloquially as VOLL) and, as a result of this activity, plenty of generation output changes are happening:
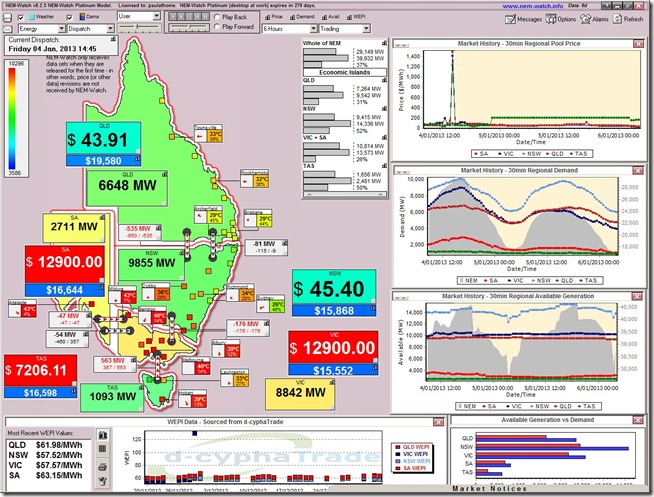
Here’s the NEM-Watch screen showing the same event, NEM-Wide, that will be more familiar for some of our readers:
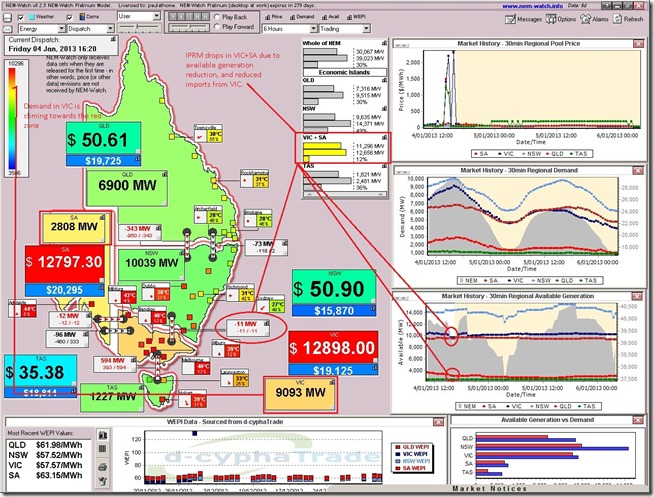
The theme for the rest of the day was much the same – showing (at 16:20 NEM time) that demand had climbed higher still in the south (though still just creeping above 30,000MW across the NEM) with prices spiking again:
We see (comparing both images above) that flows from NSW have reduced by 165MW, which is one of the reasons (along with reduced availability of generation plant) why the IRPM for the VIC + SA Economic Island has dropped to just 12% and hence triggered the yellow alarm.
At the time this post was made, the VIC demand had peaked at 9,202MW at 16:00 and had oscillated up and down as a result of various factors (including the Demand Side Response that would would have been active in the region as a result of the price spikes). In SA the demand peaked at 2,829MW at 16:10 – and, again, had oscillated due to DSR.
Across the NEM, the demand peaked today at 30,066MW at 16:15 – as noted above, a level lower than the peak demand back in 2005-06.
All in all, a very eventful day!
Call us (on 07 3368 4064) if you’d like a more detailed Case Study.


Leave a comment