Not much time today, but thought I’d put these two charts together to continue the question posed previously about declining energy consumption across the NEM.
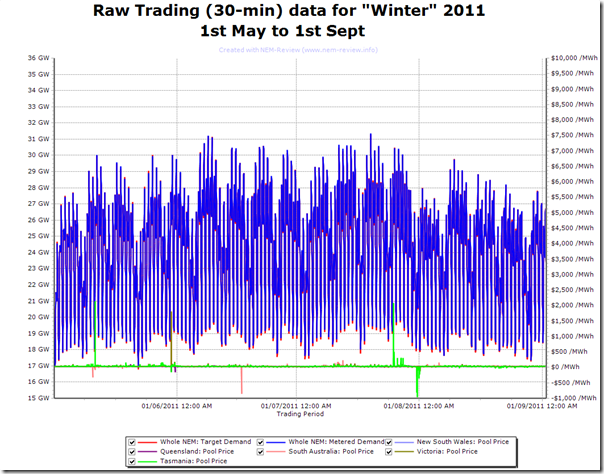
The first chart (from NEM-Review v6) is simply a trend of demand (both target and metered) for each trading interval across the winter months (plus May).
As can be seen, there were only 3 days when the demand even rose above 31,000MW – which is still a long way below the winter peak above 34,000MW in July 2008.
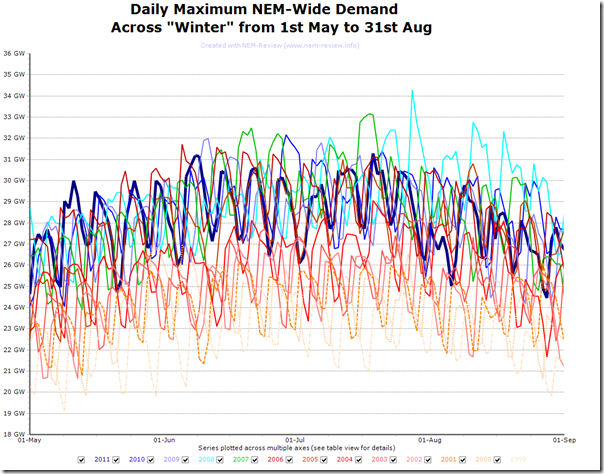
In this second chart, we compare the peak daily demand across each day in winter against previous years.
Again, we can see that demand grew fairly consistently in the early years of the NEM, but has been fairly flat in more recent times. We can also see that the peak daily demand in 2011 was consistently lower than higher demands seen in 2008 – but also in a number of other years as well.


Two comments/questions on these data:
1. Do you keep track of degree days for winter – say with 20C base temp perhaps? Or at least average ambient (not daily min/max as most commonly reported out of BOM) Degree days give a bit of insight into seasonal variation in heating load (for winter)
2. Is it just possible that the pink batts rebate is also having an impact at the margin? There was a lot of insulation put in over a short period before this program sank. I’d guess the impact would be to mitigate both aggregate heating load, and possibly peak heating load, if only a little.
Hi Jim,
Thanks for the questions:
1) Yes, we do have a record of weather data (including temperatures) – however we don’t currently have the time to do anything with them (such as comparing winters to try to understand why demand is declining). It seemed as if it was roughly a “normal” winter – though we have not analysed the data to back up that sense.
2) I’m sure that the insulation would be having some effect at reducing winter demand (and also summer) – it’s one of many contributing factors we have identified and will post about when we have time. The more challenging question is how much effect they have had – or even how we could determine this!
Paul