For those who missed it, we’re running our “Who’s the Best Demand Forecaster in the NEM?” competition again this summer. Entries have closed, but we thought you might be interested in a few charts summarising where the entries landed.
We find this a useful gauge of where the market is generally thinking the demand will be over the summer period (more about this below).
A WHAT THE ENTRIES SHOWED
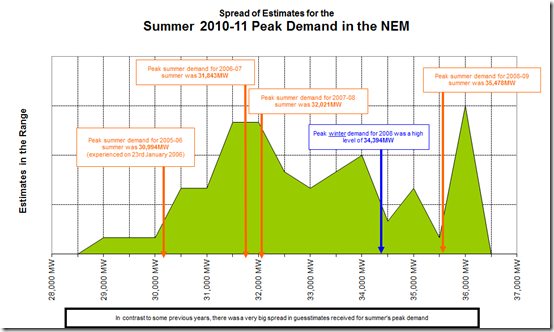
In the following chart (which is annotated with the peak demand levels achieved for summers, as measured for the purposes of our competition) we clearly see two different categories of people:
1) A tale of two viewpoints
In the following chart (which is annotated with the peak demand levels achieved for summers, as measured for the purposes of our competition) we clearly see two different categories of people:
Category A = The Bulls?
On the one hand, we have a significant group of bullish forecasters who have reckoned that the peak NEM demand in summer 2010-11 will prove to be in excess of the massive demand experienced in summer 2008-09 (when we saw heatwaves drive air-conditioning use sky-high, then followed by shocking bushfires).
The highest conforming bid received was more than 500MW higher than the demand shown in that summer.
Category B = The Bears?
On the other hand, we have a larger group of people who seem to have a consensus view that levels of peak demand won’t be significantly different from that experienced in summer 2006-07 and summer 2007-08.
Reading between the lines, it would seem that this group of people incorporates in their thinking two key points of logic:
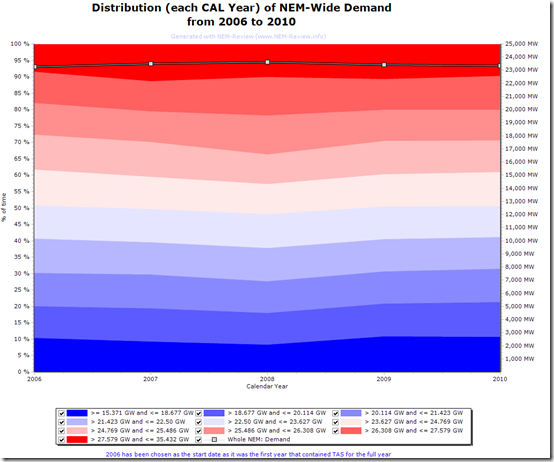
1) That levels of average demand across the NEM have remained relatively flat for a number of years, as shown below in this chart from NEM-Review:
2) That levels of peak demand are driven primarily by temperature, and that (by virtue of the La Nina weather pattern currently playing havoc with floods across the country) temperatures are likely to be relatively modest this summer.
2) Are Traders any more Homogeneous?
We’ve been curious ourselves as to whether the Traders have been any more homogeneous in terms of where they expect the NEM-Wide demand to land.
In theory, the Traders (who live and breathe the NEM every day as their reason for existence) would have a better handle on where the peak NEM-wide demand is likely to land than the “non-Trader” (which is a category incorporating a wide range of people).
Hence we used a bit of artistic licence in apportioning which of our entrants fall into the “Trader” and “Non-Trader” category. As it turns out, by a fluke of participation the numbers the numbers of both categories was approximately even.
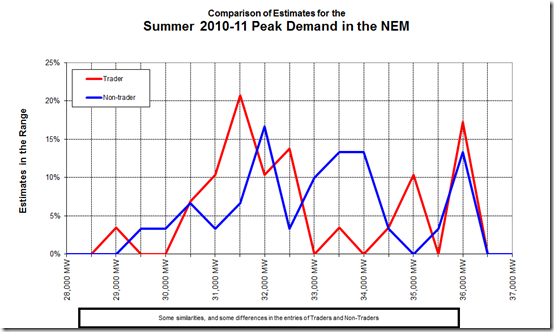
As can be seen in the chart below, the entries were surprisingly consistent between the two types of people:
The main difference between the two curves seems to be that the Trader Bears appear to be more bearish than the Non-Trader Bears.
Perhaps this is because the Traders have a better understanding of how average demand has remained flat (or perhaps we are just clutching at straws!)
3) What about Keenness?
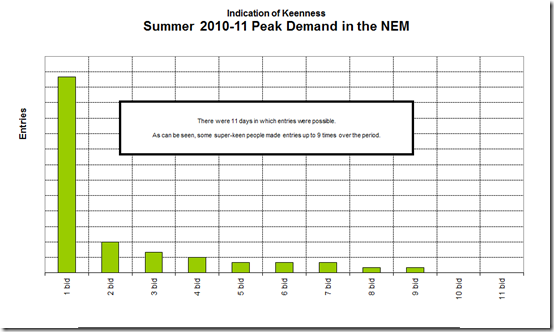
Some people noted (in the fine print for the competition) that we accepted multiple entries from the same person, up to one entry per day for the range of time the competition was running.
Hence we have taken the time to include the following chart categorising entrants according to how many entries (or bids) they made:
Some people really, really, want a new BBQ at home!
B WHY ASSESS THE ENTRIES?
In truth, the main reason is because we’re always curious to learn more – it’s just in our nature.
However, we believe that there is also a potential benefit in doing so. We’ve noted previously how the massive peak summer demand in 2008-09 seemed to surprise everyone in the market, which we don’t think was a good thing.
We would like to learn from the entries we’re receiving such that we might be able to identify ways in which we can be of service to people in the market in more accurate forecasting of where demand will land on important occasions such as these.
We appreciate that the entries we receive may not be a true reflection of where the people who need to know about demand really think the peak demand will land this summer. However when we see who makes these entries, and what organisations they are from, we do tend to believe that they are not going to be totally wild guesses.
Don’t forget to grab your own copy of NEM-Watch for the remainder of the season to keep an eye on where demand lands.


So whats the cause of the current volatility? Unbelievable.