High temperatures across the middle of Australia drove demand higher in South Australia and NSW today, leading to a level of NEM-wide demand second only to those seen in the heatwave of January 2009.
The following snapshots from NEM-Watch provide a chronological record of how the day has unfolded (to date):
Explanations:
Times shown in NEM-Watch are all “NEM Time”, which is (all year round) Eastern Standard Time (no daylight savings).
Demand shown in NEM-Watch is shown on a “Dispatch Target” basis – see here for an explanation.
Chronology:
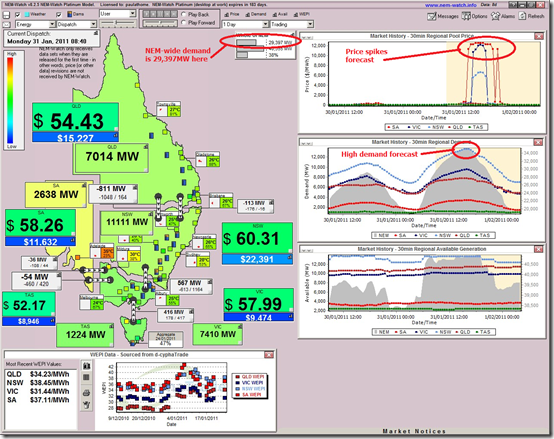
08:40 = day starts
As can be seen in this snapshot, the day starts with prices already higher than they have been for much of 2010 – and demand forecast to be very high prior to the end of the day.
At this time, we see NEM-wide demand close to 30,000MW (keep in mind that we had seen demand be very modest for the whole of December).
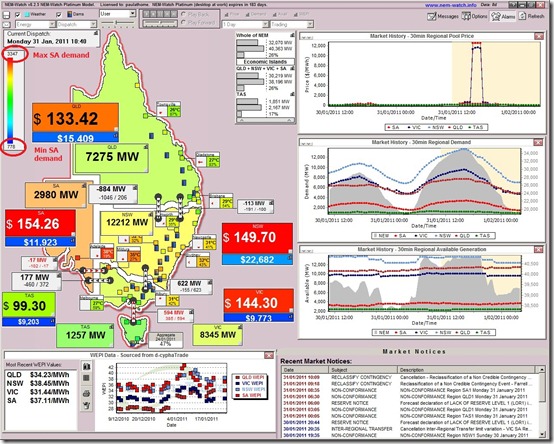
10:40 = demand breaks 32,000MW
Two hours later, we see that the demand had risen to 32,070MW (at a rate of 1000MW/h) and prices had started to climb, as well:
With the colour-coding of each region (which is set on a sliding scale with demand) we can see that the demand in South Australia and NSW has both started to creep higher (relative to their all-time maximums) compared with the demand in QLD and NSW.
See in the image above that the all-time maximum demand for South Australia is shown, on a Dispatch Target basis, to be 3,347MW in South Australia. Thus, the regional colour-coding shows the demand to be heading towards the extreme range.
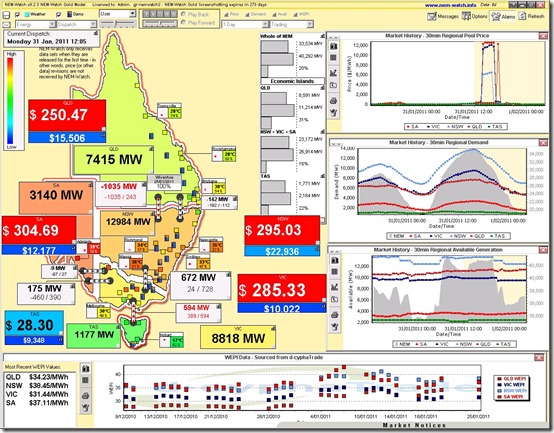
12:05 = demand breaks 33,500MW
Less than 2 hours later, we can see the demand has reached 33,534MW (averaging a rate of 1033MW/h).
We see the price spikes forecast still remain for later in the day, but that mainland prices remain around $300/MWh.
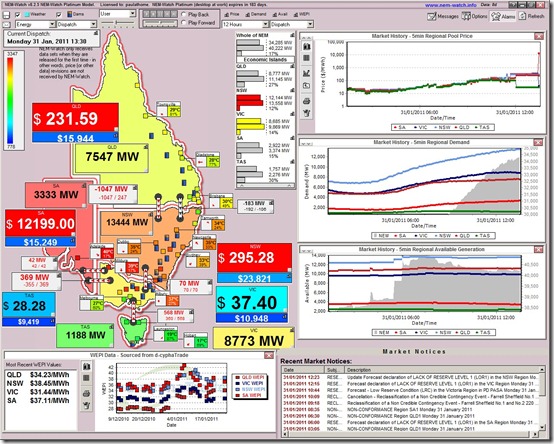
13:30 price spikes in SA
Demand continued to climb – at 13:30 reaching 34,385MW.
At this time, we can also see that the South Australian price has spiked close to the Market Price Cap, and regional demand (3,333MW) is very close to the all-time record.
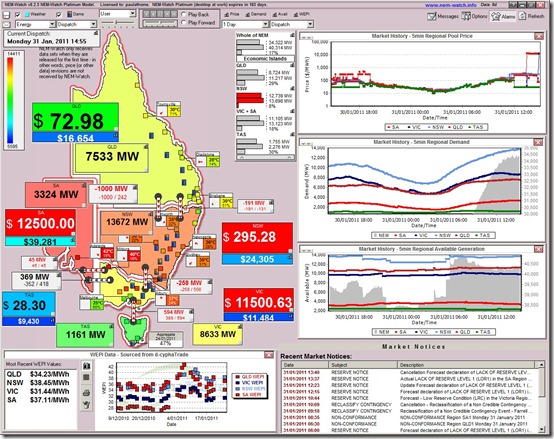
14:55 price spikes in VIC
Coincident with a 500MW reduction in output at the Newport station** (which shows up belatedly in reduced available generation for VIC at 15:05) we see the VIC price spike to join the high price in SA:
** contact us (tel 07 3368 4064) if you would like to know more about some other software we’ve developed that will enable you to understand these kinds of changes in the market, in real time.
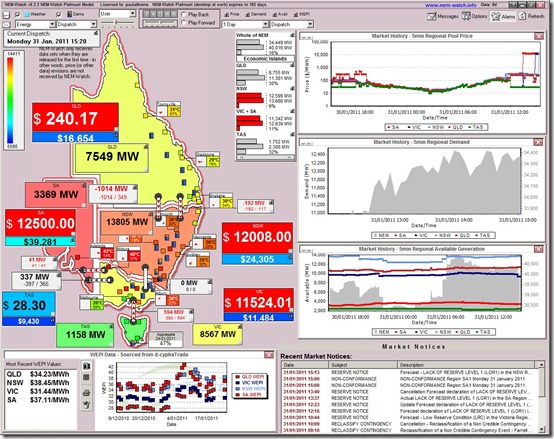
15:20 = price spikes in NSW
For the first time in the day, the NSW price spikes up close to VOLL in NSW.
As shown in this snapshot, NSW has only 1089MW of spare generation capacity not already running to meet demand, and the VIC+SA “Economic Island” has 1,297MW of spare capacity.
These relatively low numbers contribute to the low levels of Instantaneous Reserve Plant Margin (IRPM) shown (9% in NSW and 11% in VIC+SA) and explain the reason for the high prices. Because of the significance of these measures, they are highlighted in red automatically in the software.
Also in this snapshot we can see that the demand in South Australia beat the previous all-time record (a new max of 3,369MW is set).
15:25 = demand hits 34,480MW
At the time of writing, the highest demand experienced today has been 34,480MW.
Further notes:
Thankfully temperatures in Melbourne remained moderate, and well below the forecast peak for the day (which was 40 degrees, from some sources).
Had temperatures been higher there, it does seem that we would have experienced a new peak in NEM-Wide demand. As it was we were only about 1000MW below the all-time record.
With reference to the entries received in our “Best Demand Forecaster” competition for this summer – it’s clear that the Bears are out of the money, and the competition is now down to the Bulls and their entries. Stay tuned for more, as summer unfolds…
PS – the Cumulative Price rises
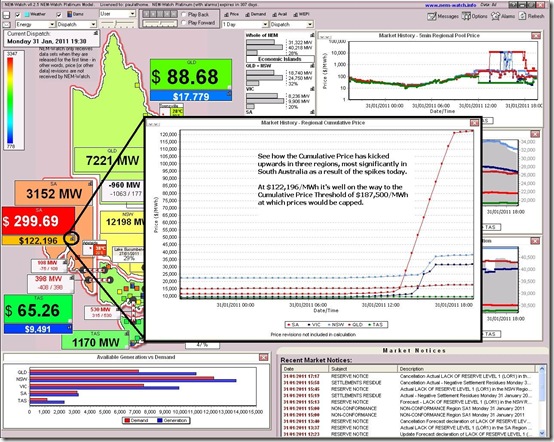
Later that evening, we can have another look at the way the market is performing. We see that prices had subsided in SA, but not fully, and that demand remains high (by virtue of the stubborn temperatures).
We see that the Cumulative Price has risen through the day in SA, VIC and NSW as a result of the spikes – but most markedly in South Australia.


Hey Paul
Great work on posting this article so promptly!!!
I’m studying power engineering at university, and I regularly visit your site. I really enjoy reading your reports on events within the NEM. Shame it wasn’t so hot down here in Vic, otherwise I also think that the NEM-Wide demand would have been clearly broken. Do you think that with most schools up and running now that the first term has started, the demand is likely to be higher due to extra HVAC load?
Also, do you know if the maximum supply available in S.A is limited by generation / transfer of power into S.A, or limits within the S.A transmission/Dist. system?
Furthermore, I would like to know whether you do a student edition of your NEM-WATCH software, for personal use.
Thanks
– Kieran