Friday 13th November, as the early heatwave in South Australia continues this week, and we saw another afternoon when prices skyrocketed, dragging the Cumulative Price towards the Cumulative Price Threshold.
Cumulative Price = the rolling 7-day total of the most recent 336 trading prices for the region.
Cumulative Price Threshold = Currently set at $150,000/MWh
When the Cumulative Price Threshold is reached, price caps are imposed in the region in which the CPT has been reached. By virtue of the interconnected nature of the NEM, this price cap also has an impact on the prices that can be reached in other regions, in certain circumstances. The current price cap is set at $300/MWh.
In simple terms, the CPT and price caps are provided for in the rules as a “safety valve” for the market. This is required to help prevent retailers going out of business – the reason retailers would go out of business is because of the timing difference between when the retailers need to pay for electricity in the wholesale market, and when they recover payments from consumers (including residential customers) in the retail market.
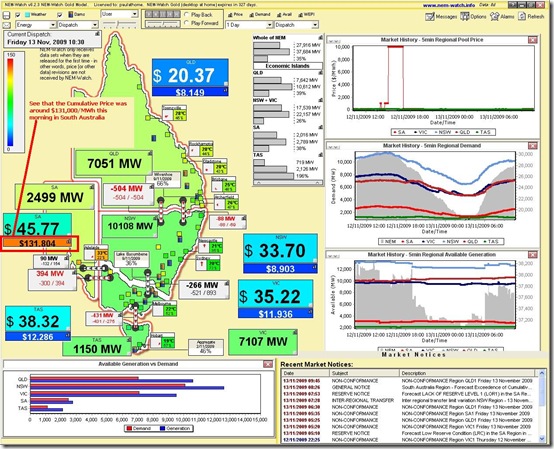
The morning started innocently, as seen in this snapshot from NEM-Watch at 10:30 (NEM time) this morning:
For all of these images, click the image for a better view – opens in new window.
We can see how the Cumulative Price was high already in the morning, due to spikes on the preceding Thursday (12th), Wednesday (11th) and Tuesday (10th).
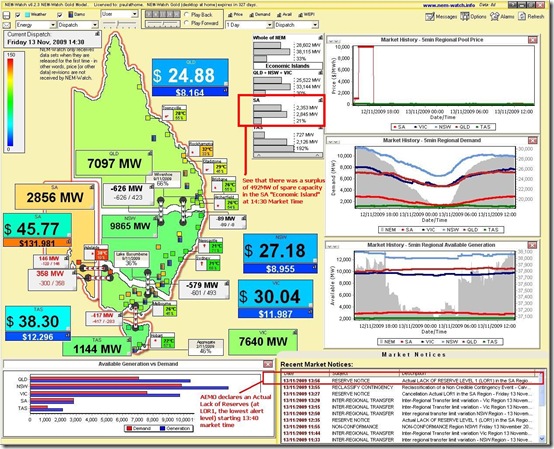
In the snapshot from 14:30 we see how the AEMO was warning of a Low-Reserve Condition at its lowest alert level (LOR1).
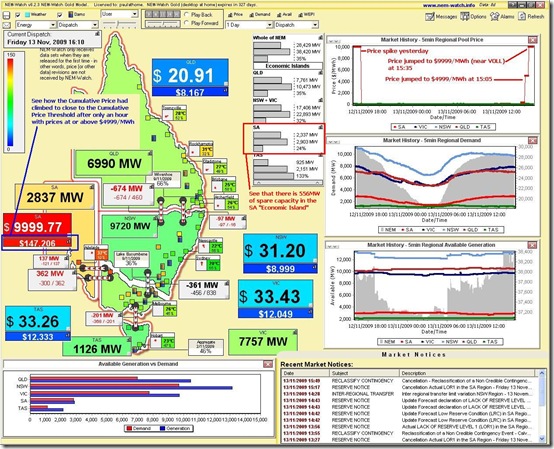
In the next snapshot included (at 16:10 NEM time), we see that the price had jumped to VOLL.
Note also in this snapshot that there has been a marginal increase in spare capacity available in the South Australian region (compared with the level shown above 100 minutes previously)! You can also see a decrease in demand in SA, which could be due to industrial energy users providing demand-side response (for their own commercial benefit), and/or due to the initiation of collective residential demand-side response by such operators as ETSA.
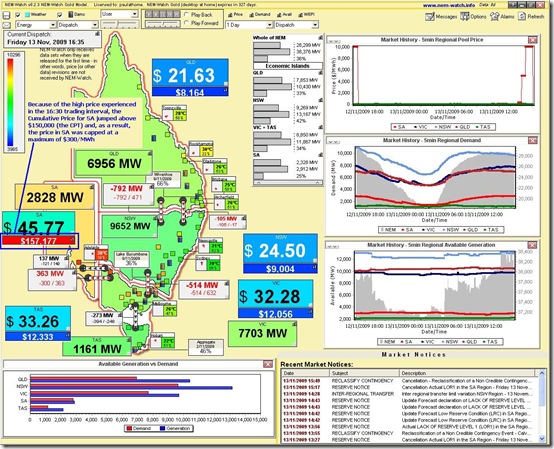
At 16:35 (only 25 minutes later) we see the effect of the last 1/2-hour’s price spike, as the Cumulative Price hits the threshold and prices are capped in South Australia.
During the past week, we have fielded calls from a number of parties who have asked us questions about what was happening in the market.
Note that we’re a small company staffed predominantly with software developers, and would prefer to let our software do its own talking. However, as we are keen to “make the electricity market understandable” (at least to the best of our ability) we will try to answer questions.
1) Revenues Earned by AGL Energy due to the price spikes
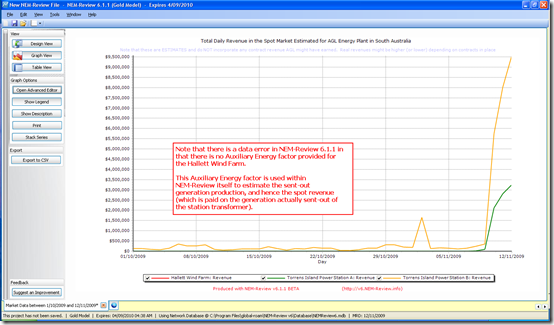
One of the questions we’ve been asked (as a result of their being named in AER investigations) was the amount of revenue earned by AGL Energy as a result of these price spikes.
The following chart was generated using a beta version of NEM-Review v6 (specifically v6.1.1), which is still under development.
This chart shows an approximation of the total daily spot market revenue earned by AGL Energy’s stations in South Australia.
This calculation shows only spot market revenues. Contract cover is unknown to anyone other than the generator in question (in any case) and hence can’t be estimated with any accuracy.
The effect of the price spikes is clearly visible, and we assume that AGL would have kept at least some of this benefit (i.e. assuming their output was not fully hedged).
As noted in the image, a lack of a single value for the Hallett Wind Farm has meant that revenues have been shown above as zero, which is not the case. For your comparison purposes, I have separately calculated the spot revenue (i.e. excluding REC revenue, etc) as being of the order of $600,000 on Thursday 12th November (yesterday).
One advantage of the new version is that you will be able to calculate station (spot) revenues from within the application directly, as shown above (though we will have ironed out all of these data glitches before final release).
Mind you, the BETA is up now, so you can take it for a test drive straight away!
2) Putting the price cap into context
The reaching of the Cumulative Price threshold in South Australia today is only the 5th time (in total for all regions) this has occurred in the 11-year history of the NEM. The other instances were as follows:
Instance #1) In March 2008, SA hit the CPT
Instance #2 and #3) In January 2009, SA hit the CPT first, closely followed by VIC
Instance #4) In June 2009, TAS hit the CPT
Why is it that, after 9 years of NEM operation without the CPT being reached (1999-2007) we have 5 instances in the space of only 21 months?
At the moment we don’t have an answer to this, but it might be due to a number of variables including the folloiwng:
Possible Contributing Factor #1) Accelerating growth rate of peak demand, making volatility more likely
Possible Contributing Factor #2) The possibility of an increasingly tight supply/demand balance across the NEM (note that this has been mentioned by others in public forums, but I have not yet had the time to check this for myself)
Possible Contributing Factor #3) Changes in ownership structure of the generation portfolio
Possible Contributing Factor #4) Greater vertical integration (the emergence of the “Gentailer” model)
Possible Contributing Factor #5) Changes in the bidding behaviour of generators, possibly as a result of the above and more
There are many others…


Leave a comment