
- Background
- The extremes of price volatility experienced in winter of 2007 – the content of which has been reported here:
- The nature of peak demand forecasts (for winter in the NSW region) over the coming 10 years – the content of which has been reported here:
- As an aside to these separate pieces of analysis, Paul made a few points with respect to the implementation of the Emissions Trading System, scheduled for introduction from 2010, and specifically the possible emergence of a NEM heavily dependent on gas supplies, which might be unreliable – the content of which has been reported here:
- Specific Comments
Our Managing Director spoke at the “Australian Energy & Utility Summit 08” in Sydney on Tuesday 22nd July 2008.
In his presentation, Paul touched on a number of issues, including the following:
As a bridge between discussions about the past and considerations of the future, Paul spoke briefly about what has been happening in winter 2008.
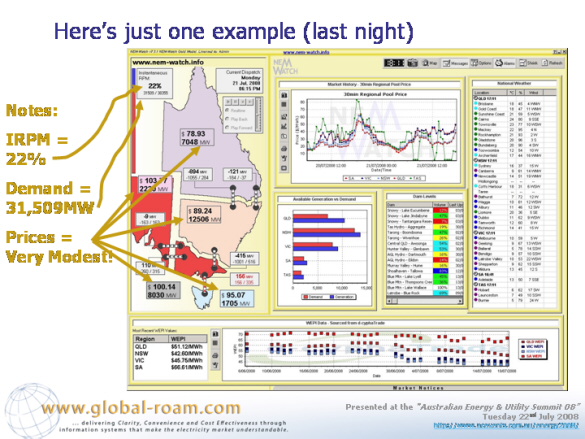
Illustration was provided, in NEM-Watch, of the way in which prices have been very subduedover the winter period (to date):
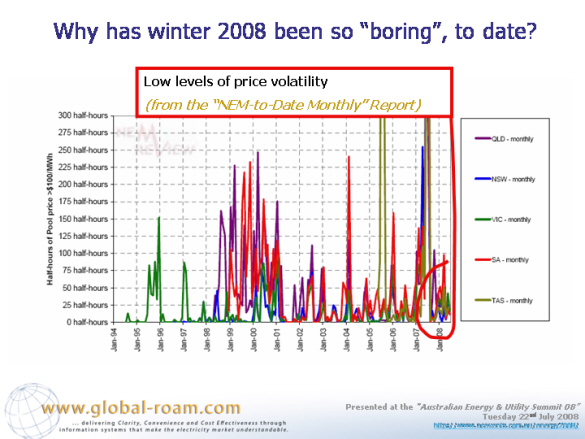
Although not much time was available to postulate, in detail, why prices have been subdued this summer, it was noted that the number of half-hours with prices above $100/MWh was very much reduced:
This would be due, at least in part, to the lower levels of (both peak and average) demand seen in the NEM over the past 9 months or so:
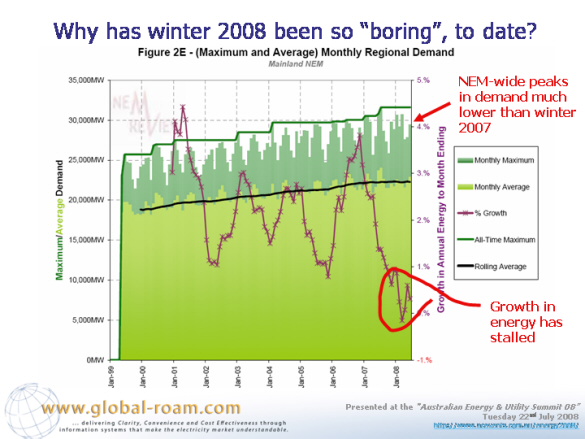
Both of these reports are taken from the “NEM-to-date-Monthly” Report from within NEM-ReviewTM.
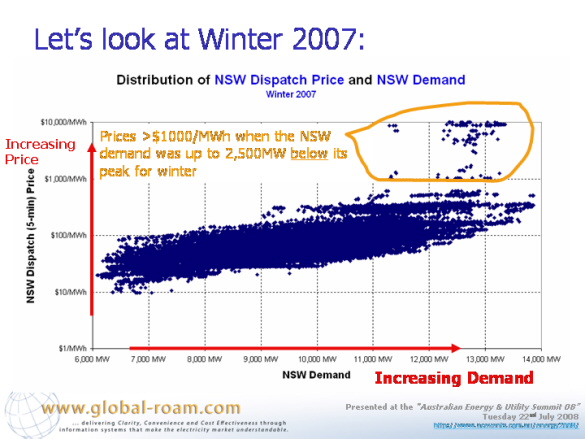
As can be seen, the situation is largely as expected, with prices increasing with increase in demand. However it is noted that some of the volatility occurred when NSW demand was significantly below the peaks achieved over the winter period.
It was thought that the situation might be clearer if the NSW prices were correlated against NEM-wide dispatch demand, as shown here:
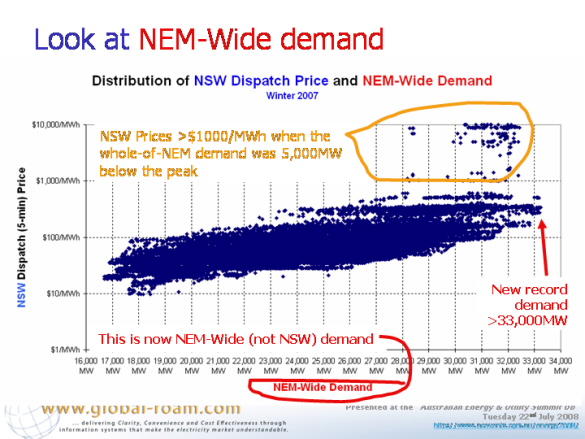
However a similar situation is apparent in this chart.
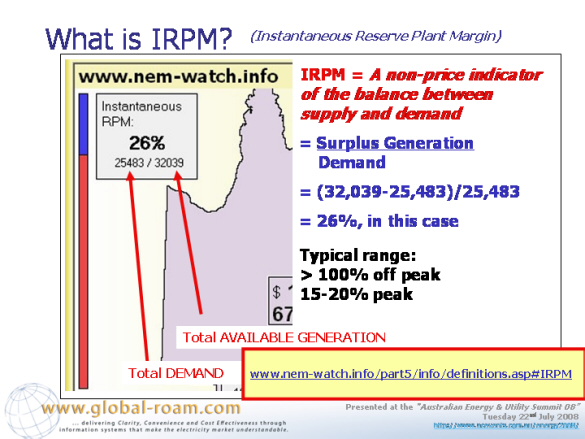
To understand further, we looked at the definition of Instantaneous Reserve Plant Margin, as used in the NEM-WatchTM product.
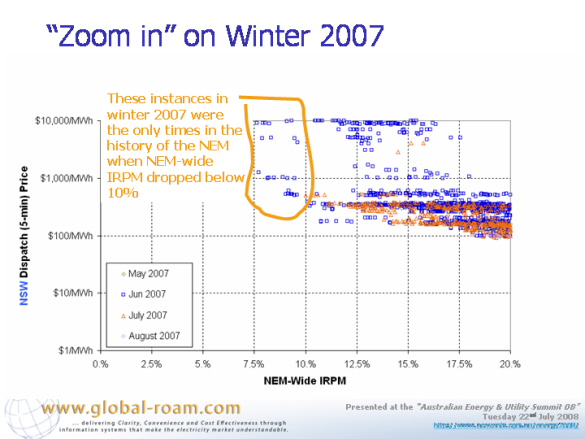
The following chart shows the correlation between price and IRPM:
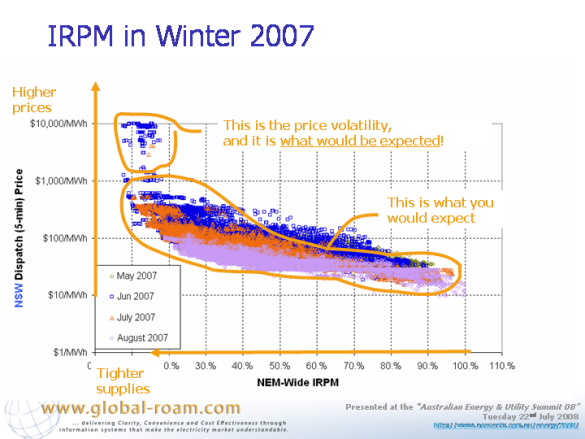
This was particularly of interest, given the situation uncovered in QLD in the previous analysis for summer 2007-08, whereby high prices had been engineered by QLD generators, when NEM-wide IRPM was high, and even when there was significant surplus of capacity available within the QLD region.
In particular, it was noted that these high NSW prices in winter 2007 occurred across a broad range of interconnector constraint scenarios.
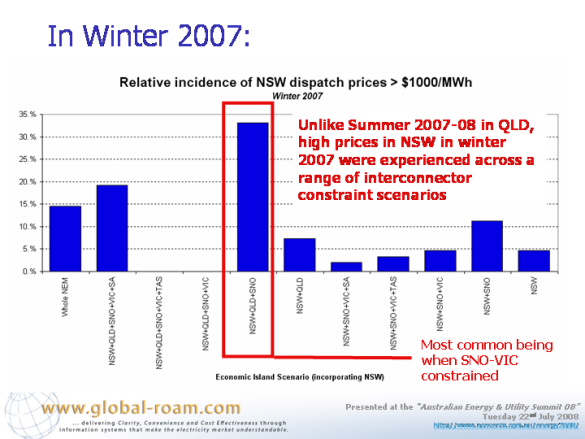
This was unlike the situation in summer 2007-08 for QLD, when prices were only high on occasions when QNI was constrained flowing north (i.e. when QLD generators had local market power).
During the presentation, the low reserve plant margins experienced in winter 2007 was highlighted as well:
An illustration was provided of how these events were represented in NEM-Watch:
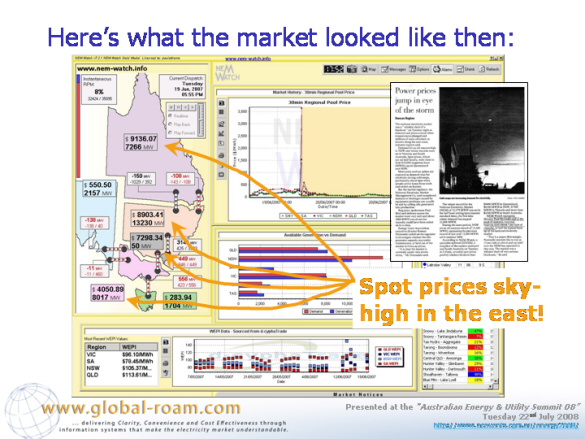
Reference was made to the news article written in the Australian Financial Review to document this event.
Be the first to comment on "Prices depressed in the NEM – Winter 2008"