
- Index
- Background
- Outline of the Study
- Results of the Study
- Distribution of Prices
- Distribution of NEM-Wide IRPM
- Correlation of Price and IRPM
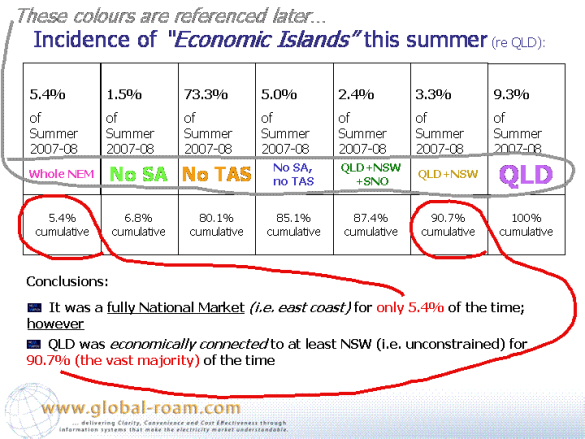
- Incidence of “Economic Islands”
- IRPM relative to “Economic Islands”
- Further Analysis
- Correlation between price and IRPM
- Cost to Energy Users
- Summary
- A few First Principles
- Points for further consideration
- Background
- Outline of the Study
- Prices
- IRPM
- Economic Islands
- Results of the Study
- Distribution of Prices
- Distribution of NEM-Wide IRPM
- Correlation of Price and IRPM
- Incidence of “Economic Islands”
- An Economic Island containing QLD-NSW-SNO-VIC;
- An Economic Island of SA
- An Economic Island of VIC.
- IRPM relative to “Economic Islands”
- Further Analysis
- Correlation between price and IRPM
- Cost to Energy Users
- Summary
- For most of the time (indeed, more than 90%) the Queensland region was connected to at least NSW, and generally to Snowy and beyond – hence for most of the time, it was a national market (as far as QLD is concerned);
- On all of these occasions, there was plenty of competition in the generation sector, resulting in the generator’s inability to game the market and hence prices close to the median;
- For most of the time that QNI was constrained, as well, prices behaved as they would be predicted, in theory;
- For only 11.25 hours in total (or <0.5% of the time over summer, and indeed over 5% of the sub-set of time when QNI was constrained) prices jumped above $1,000/MWh. Hence, these spikes were a rare event;
- These spikes occurred even when QLD generators were sitting on significant surpluses of generation capacity. From this it could be concluded that, the four significant generators in QLD are not sufficient of number to prevent the exercise of market power, on some rare occasions.
- Even though these spikes were rare occurrences, they had a massive impact on the total cost of energy to QLD energy users, over the summer.
- If similar situations were to arise over summer 2008-09, and into the future, it is quite conceivable that similar costs might be imposed, collectively, on energy users (and so on);
- This analysis has not considered, at all, the costs to energy users in NSW of generators doing the same thing there (but at different times) when QNI was constrained in the other direction;
- Such possible costs, when compared to the stated cost of a duplication of QNI ($900M for a full duplication) appear on this preliminary analysis to make the upgrade an obvious choice – however more detailed modelling would be required, of course, to confirm this;
- HOWEVER, the upgrade to the QNI interconnector is not currently justifiable (as, in the wording of the Regulatory Test, such costs are deemed “wealth transfers” and so are not a whole of market benefit – as what is a cost to an energy user will just be a profit to a generator).
- A few First Principles
- Points for further consideration
- Upgrade of QNI
- Buy the NSW Generators
On 12th March 2008, our Managing Director (Paul McArdle) was asked to speak at the “QLD Energy” conference in Brisbane.
Specifically, Paul was asked to talk about “Volatility in the NEM”. To facilitate some detailed analysis, we chose to limit the scope of the topic to volatility in the QLD region of the NEM, only – and over summer 2007-08 only.
Given the timing of the talk, a set of dispatch (i.e. 5-minute) data was extracted from our infoserver replica database for the period mid-November 2007 to early-March 2008, which we shall refer to as summer 2007-08.
It is important to note that this time period did NOT include the times during which the heatwave was experienced in South Australia and Victoria (later in March). This has been analysed separately, and is reported here:
With the data set selected, we chose to analyse three different factors, as follows:
Naturally, we would need to study spot prices in a study of volatility.
It was a deliberate choice in this study to focus on dispatch (5-minute) prices, as opposed to trading (30-minute) prices – as it is over the dispatch interval that the volatility is especially apparent.
We also included an analysis of NEM-Wide Instantaneous Reserve Plant Margin (IRPM) as a holistic, non-price-based indicator of the overall balance between supply and demand in the NEM.
The IRPM has been displayed in NEM-Watch for a number of years. With NEM-Watch version 7, it is shown in the following location:
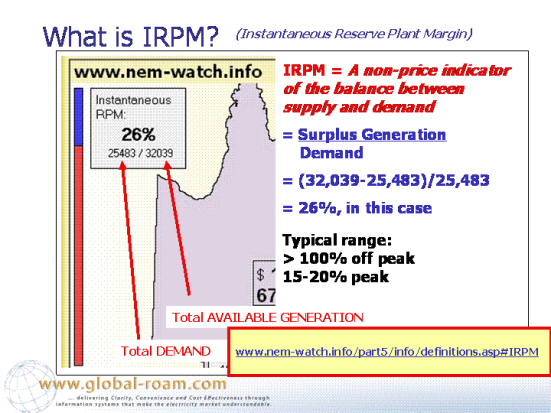
This metric is explained in the Glossary contained within the NEM-Watch portal at this address:
It is important to note that the IRPM is calculated as a “whole of NEM” figure, and as such does not take into account the impact of transmission constraints on local supply/demand balance within a given region.
For some of the time, the NEM is a fully national market, with no inter-regional constraint limits binding over interconnectors. At such times, there will be a single marginal generator setting the market price in all regions (with the small differences between the regions resulting from dynamic inter-regional loss factors).
However on occasions interconnector constraints do bind and, on such occasions, generators on one side of the link will be unable to influence the market price on the other side. When this occurs, what we term as an “Economic Island” has been created – whereby there will very likely still be power flowing from one side of the link to the other, but the generators on the constrained side are economically disconnected.
At such times, prices can (and do) separate, sometimes by significant amounts.
Hence, to complete our study, we looked at the incidence at which economic islands occurred with reference to the QLD region over summer 2007-08, and (at such times) what an effective local Instantaneous Reserve Plant Margin was, with respect to the QLD region.
This report summarises the results of the study we performed.
With the data set selected, we chose to analyse three different factors, as follows:
For simplicity, we defined “price volatility” as any dispatch price above $1000/MWh – this crude definition is sufficient for our study.
As shown in the following slide, prices were volatile for only a very small percentage of the time (<0.5% of the time, or 11.25 hours over the summer period in total).
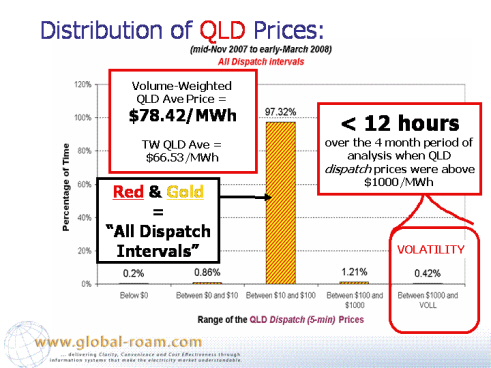
It is also noted that the vast majority of prices (>97%) fell in the range between $10/MWh and $100/MWh.
This result was not surprising, given the nature of the National Electricity Market.
We similarly looked at the distribution of IRPM for each of the dispatch intervals over the summer period.
The following chart provides an illustration of this:
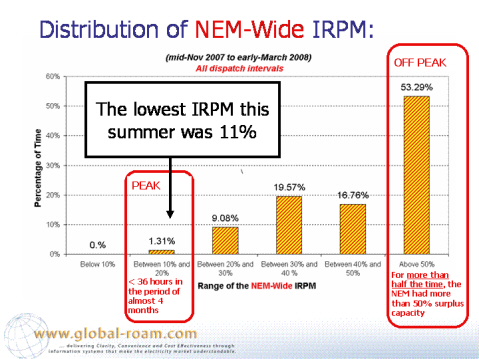
Once again, this distribution is not a surprise.
In comparison to a period in June 2007 when the IRPM dropped as low as 7.6%, a low of 11% over this summer period is seen as very reasonable. To put this into context, this meant that there was (even when supply/demand was tightest) at least 1000MW more spare capacity available to the market than was the case in June 2007.
The low of IRPM experienced in June 2007 was previously analysed here:
In theory, prices should be high when the supply/demand balance is tight (i.e. IRPM low) and, conversely, prices should be lower when there is plenty of surplus capacity.
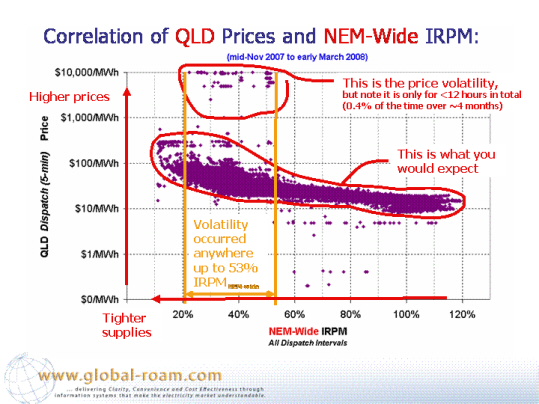
As can be seen in the chart above, for the vast majority of dispatch intervals, this indeed is what did happen (i.e. most of the time, the market behaved as expected).
However, we also see that the instances when dispatch prices were above $1000 occurred at a wide range of NEM-Wide IRPM, which is not what we would typically expect.
To understand why this was the case, we have to look a little further.
To understand why this was the case, we looked at the incidence of QLD-centric Economic Islands across the summer period. By “QLD-centric” we mean the instances where economic islands existed containing the QLD region.
We should first clarify what we mean by an “Economic Island” by using an illustration from NEM-Watch (in NEM-Watch, the interconnectors are shown as red when they are constrained):
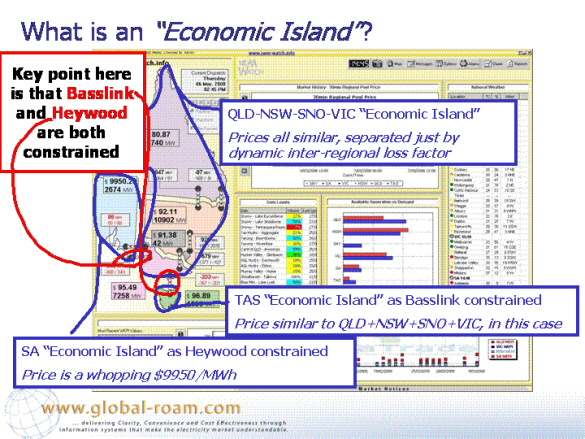
In the case shown, 3 Economic Islands exist:
In our study, we looked at only those Economic Islands containing QLD (as these are the only ones that could have an impact on QLD prices). Hence, this should be considered an incomplete study of the whole of the NEM.
The table shown below highlights the incidence of the various Economic Islands across the NEM
On instances where constraints exist and hence an Economic Island is created, the NEM-wide IRPM is not that relevant to the price set in the QLD region. This is because a generator outside of that Economic Island will not be able to supply the next marginal unit of generation in the QLD region.
Hence, we translated the definition of NEM-Wide IRPM into a definition of the IRPM for an Economic Island, as follows:
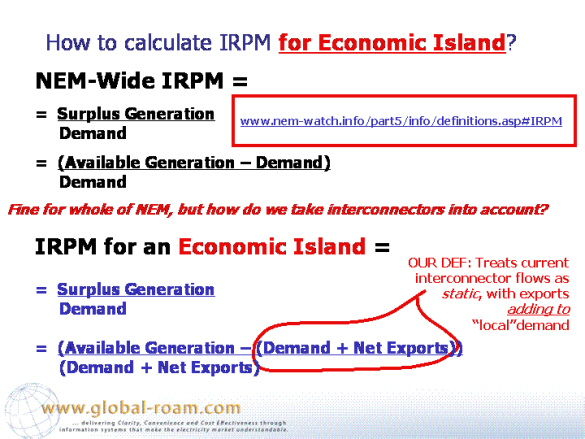
As shown in this slide, the new definition takes into account the externalities present in relation to the Economic Island (specifically the interconnector import into (or export from) the economic island.
In the interests of brevity, a number of points of analysis have been omitted from this blog entry about the economic islands. Please contact us if you would like a full copy of this analysis.
The core finding, however, is as follows:
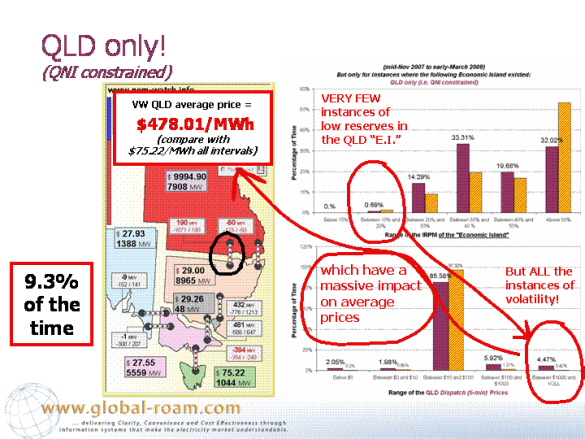
As noted in the slide, ALL instances of volatility occurred when QNI was constrained, and this had a major impact on the voliume-weighted average price of power over all dispatch intervals when QNI was constrained.
As noted above, there appeared to be an aberration in the correlation of QLD prices against NEM-Wide demand (in that high prices occurred even when IRPM was above 50%).
It was thought that, in focusing on the IRPM for the Queensland-Only Economic Island would reveal a more typical correlation. Hence we put together the following chart (keep in mind that in defining the IRPM for the QLD only economic islands we treat interconnector flow as if it is static, and that imports to the region are subtractive from the native demand that would need to be supplied by QLD generators).
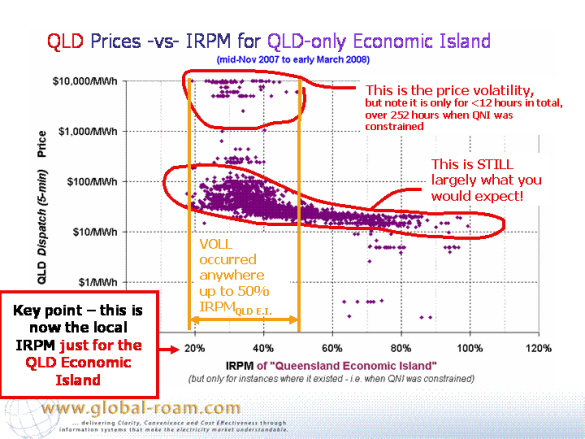
This chart is quite startling in clearly illustrating that, even just taking into account local available supplies, QLD prices were high even when the IRPM was as high as 50%.
Put another way, on these instances when prices were high, we had perhaps 2,000MW of spare capacity bid at or above the spot price, which was at least $1,000MWh and may have more typically been $6,000/MWh. This is clearly evidence of generator’s “strategic withholding of capacity” that we first analysed in relation to winter 2002, as shown here:
Specifically in relation to QLD prices in summer 2007-08, we had (separately from this analysis) put together this summary of market behaviour attached to price spikes that occurred in QLD on Friday 22nd and Saturday 23rd February 2008:
In summary, we calculated that these 11.25 hours where dispatch prices were above $1,000/MWh over the summer period added a total of $690M onto the total cost of energy paid (collectively) by QLD energy users.
This is a staggering cost, when taking into consideration that the total cost over the remaining number of hours in the study was less than this amount – meaning a total cost over the period of $1.2b.
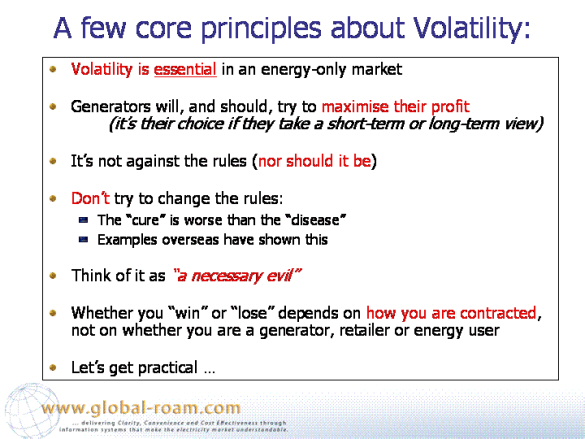
In summary we can conclude the following:
Before you jump to conclusions and think that we are bashing the design of the NEM, or the Regulatory Test, or the generators, or anyone in particular, please read this:
With this in mind, we would like to propose a few practical ideas that should be given further consideration.
With the data set selected, we chose to analyse three different factors, as follows:
Given that the upside to costs of price volatility is potentially very large (as we have seen in summer 2007-08) it is imperative, from the point of energy users collectively, that QNI is upgraded – hence much reducing the potential for individual generators to engineer volatility into the price.
Advocating for a change to the Regulatory Test may be effective – however I would not hold your breath!
It would be akin to praying for the fairy godmother to save us, in my view, because any change that would justify the QNI upgrade would be, in effect, prioritising monopoly transmission investments over competitive generation investments – and open up a “Pandora’s Box” about gold plating of the system, etc…
Even on the off-chance it did succeed, it would most likely take a couple of years in the reform process before TransGrid and Powerlink can start actually implementing the upgrade.
Additionally (and I have to admit that I have no knowledge that generators actually do this) it seems to me that generators would have a vested interest in ensuring that QNI is never upgraded (in order to protect their precious opportunities to engineer high prices) and hence could strategically game the Regulatory Test by committing increments of new plant sufficiently large to have the effect of continually pushing QNI out on the planning horizon.
There is an alternative, however!
All that would be required for a duplication of QNI to be implemented would be for energy users, collectively to fund part of the cost of the upgrade – with the amount to be funded enough to reduce the capital cost to the TNSPs such that QNI upgrade becomes justified under the regulatory test.
To me, the option of funding part of a $900M capital project to have the benefit of avoiding costs that could be as high as $690M each and every year, is worth further urgent consideration!
We have seen (through the summer 2007-08) the NSW generators (and those further south) were able to have a moderating impact on QLD prices when QNI was not constrained. In other words, there was sufficient competition at those times.
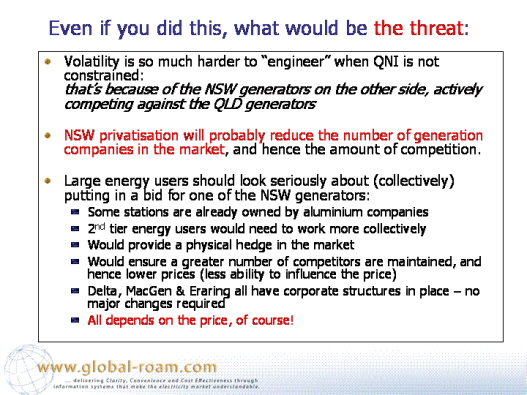
The most likely outcome from the sale (or long term lease) of the NSW generators is that they will be bought (or leased) by some of “the usual suspects”, by which I mean companies like AGL Energy, Origin Energy, TRUenergy, B&B Power and Internationalpower – all of whom have some existing investments in generation plant around the NEM (and in some cases in QLD).
What this will mean, inevitably, is a higher chance that the reduced number of generators will be able to find opportunities to engineer (highly profitable for them, highly costly for energy users) volatility in the market.
Hence, one of the options that the energy users (collectively) should consider would be to purchase one or more of the generation companies. Perhaps they could think of this as an option to purchase a physical hedge in the market (albeit one that would be larger than the load of any individual energy user).
There are some precedents to this occurring – such as the purchase (by Comalco and others) of the Gladstone plant, but given the size of the three NSW generators it would require a collective effort on the part of the energy users.
Admittedly, this idea is a little out of left-field – but again is worth further consideration.
However, it is also worth considering that the QLD generators would also stand to gain significant benefit from a purchase of (or merger with) the NSW generators.
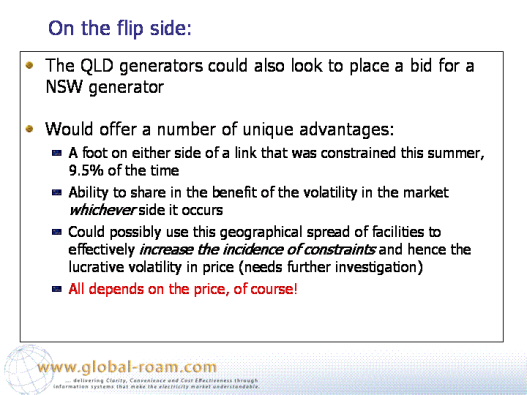
Such a move would give them a foot on either side of the QNI interconnector, which could possibly provide them added opportunity to bid in such a way as to constrain the interconnector and hence extract volatile pricing on one side, or the other (depending on market circumstances).
Obviously you would need to do more detailed modelling to check this hypothesis!
Also, it is thought that the QLD Treasury (as shareholder for the 3 generators) would not be keen on the idea.
Leave a comment